
Fig. 7. Pyrimidine metabolism informs poor clinical outcome in glioblastoma.
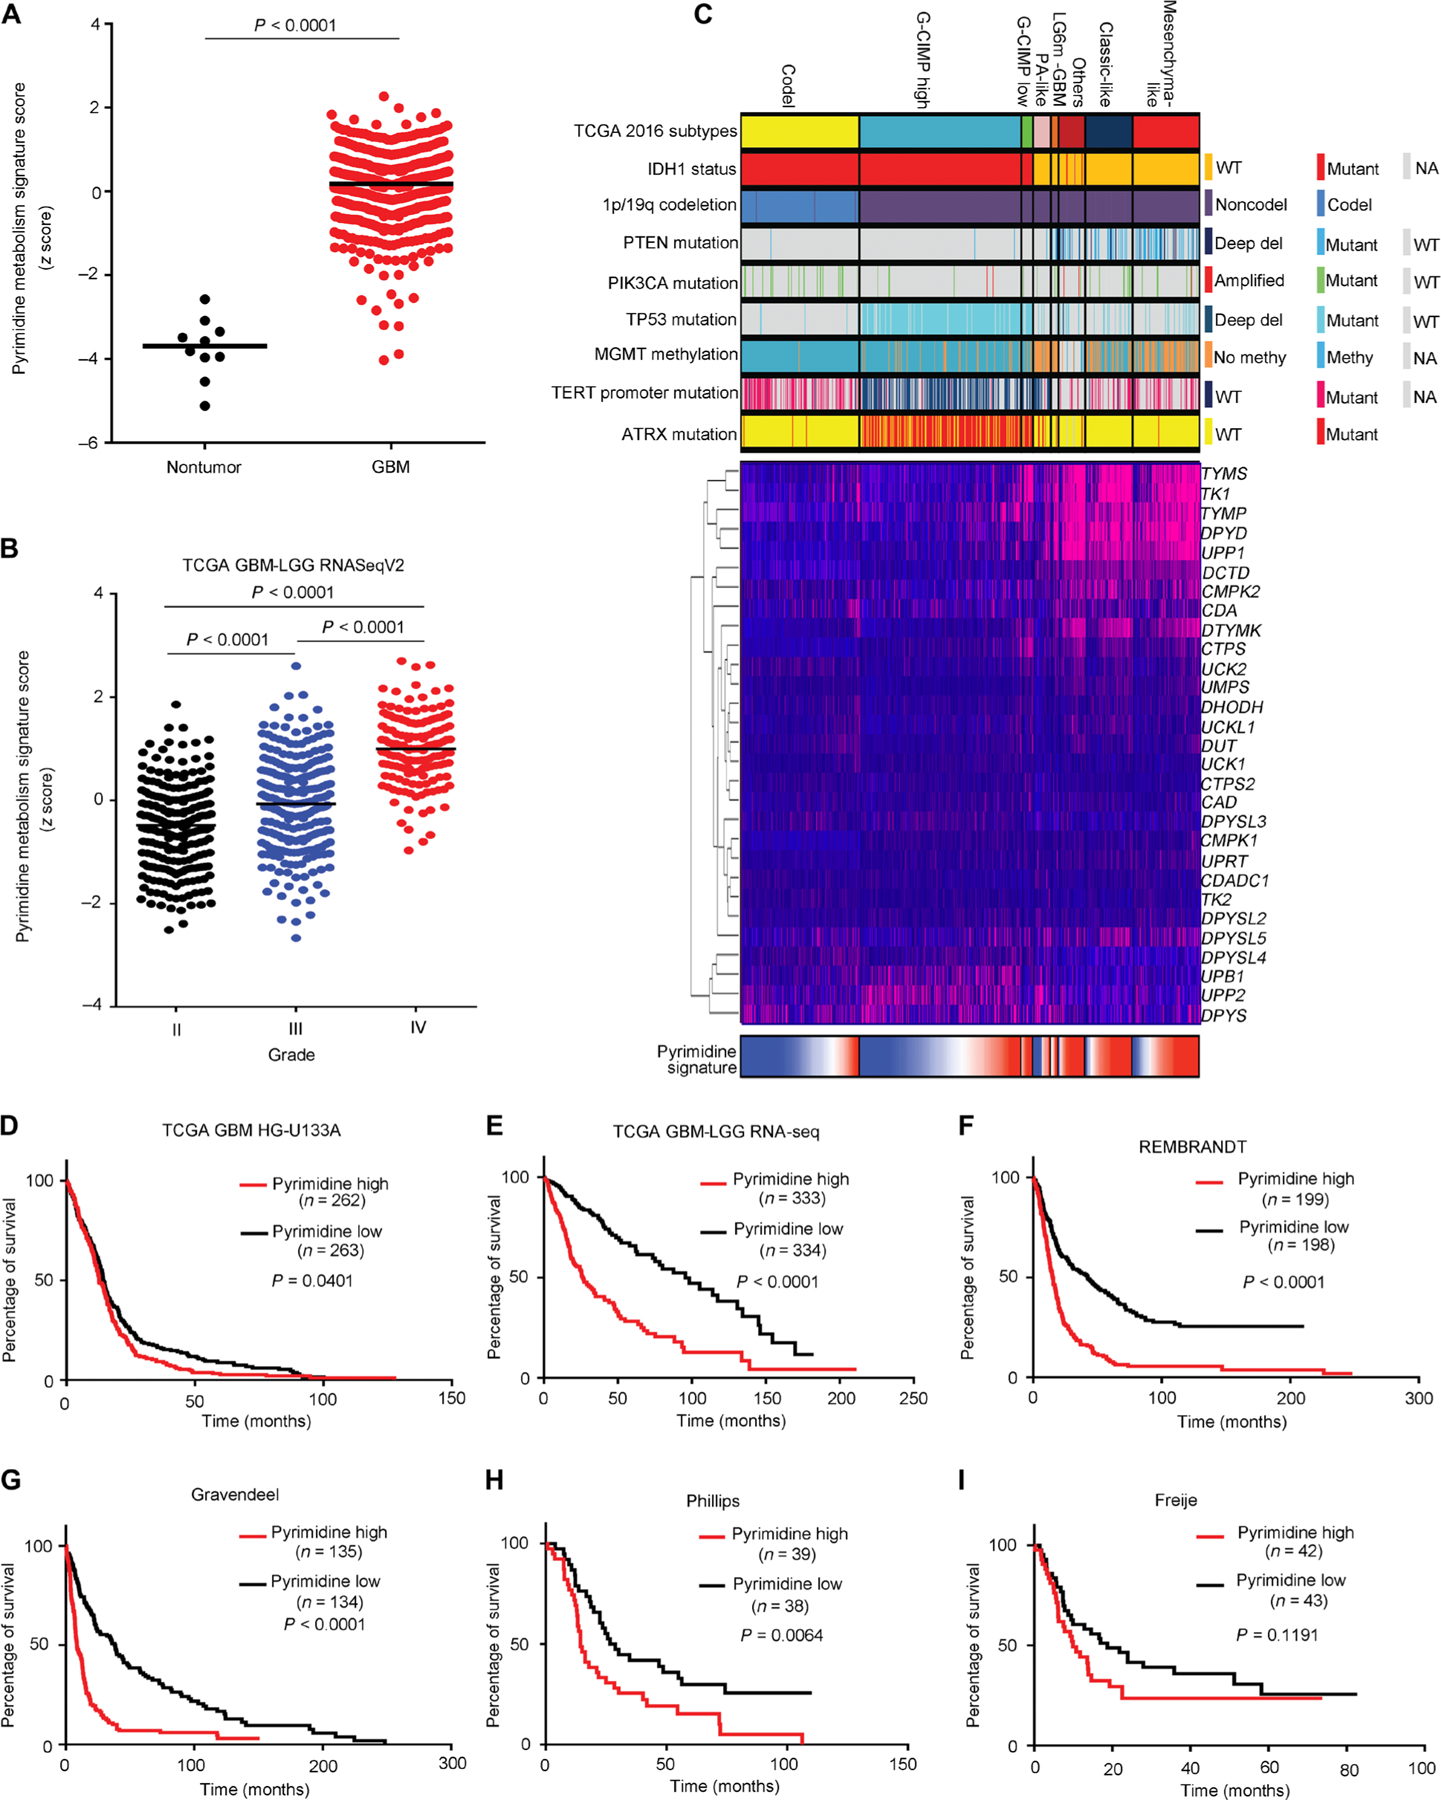
(A and B) KEGG pyrimidine metabolism signature ssGSEA score distribution between nontumor and tumor specimens in TCGA glioblastoma (GBM) HG-U133A (A) and among different grades in TCGA glioblastoma-LGG RNA-seq V2 datasets (B). (C) mRNA expression pattern of genes comprising the KEGG pyrimidine metabolism signature and corresponding ssGSEA score distribution in TCGA glioblastoma-LGG cohort (n = 667) stratified by TCGA DNA methylation cluster groups and associated molecular markers. G-CIMP, glioma CpG island methylator phenotype. (D to I) Kaplan-Meier survival analysis based on KEGG pyrimidine metabolism signature ssGSEA scores stratified by the median of six different glioma datasets: (D) TCGA glioblastoma (34), (E) TCGA glioblastoma-LGG RNA-seq (35), (F) REMBRANDT (36), (G) Gravendeel (37), (H) Phillips (38), and (I) Freije (39).