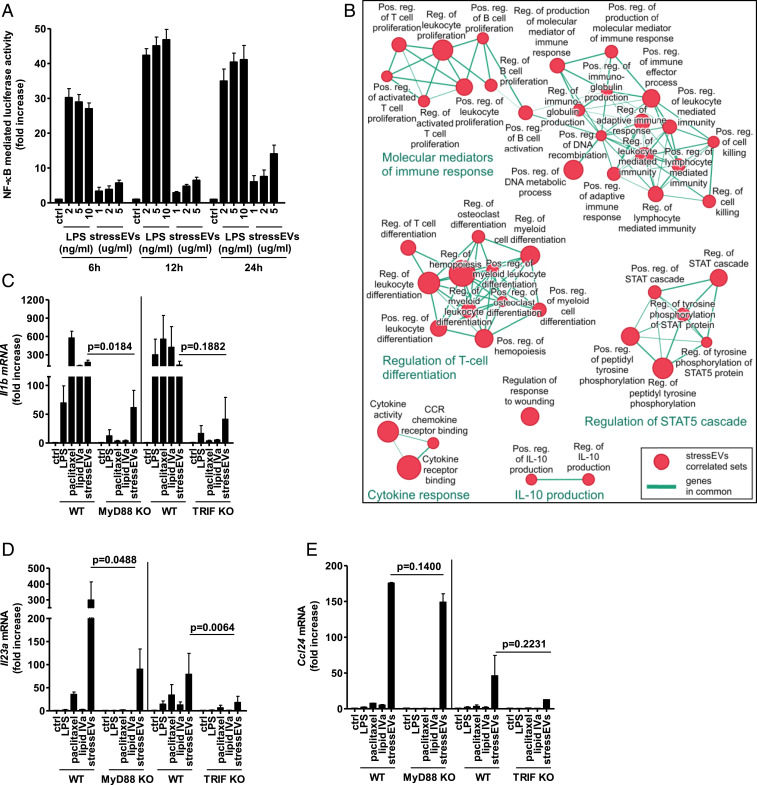
Fig. 1.
StressEVs and paclitaxel stimulate TLR4/MD-2 differently from LPS and lipid IVa. StressEVs were isolated from HEK293 cells stimulated with A23187. (A) HEK293T cells were transfected with plasmids for hTLR4, hMD-2/CD14, firefly luciferase under NF-κB promotor and Renilla luciferase for normalization. HEK293T cells were stimulated with stressEVs (1, 2, or 5 μg/mL) or LPS (2, 5, or 10 ng/mL) for 6 h, 12 h, or 24 h. A dual luciferase test was performed. Negative controls are transfected but unstimulated cells. (B) The Enrichment Map displays the enriched gene sets in stressEV-stimulated cells as analyzed by GSEA. Red dots represent increased expression, and the dot size is proportional to the enrichment significance. Related gene sets (with some genes in common) were manually grouped into clusters and assigned a label. We display only the sets with high significance of differential expression (FDR < 0.001). (C–E) WT or MyD88 KO macrophages and WT or TRIF KO BMDMs were stimulated for 6 h with paclitaxel (50 μM), lipid IVa (100 ng/mL), stressEVs (10 μg/mL), or with LPS (2 ng/mL). Il1b, Il23a, and Ccl24 mRNA levels were determined using qPCR. (A) Three independent experiments (indep. exps.) (n = 9); (C and D) three indep. exps. (n = 3); t test (one-tailed; paired); (E) two indep. exps. (n = 2); t test (one-tailed; paired).

