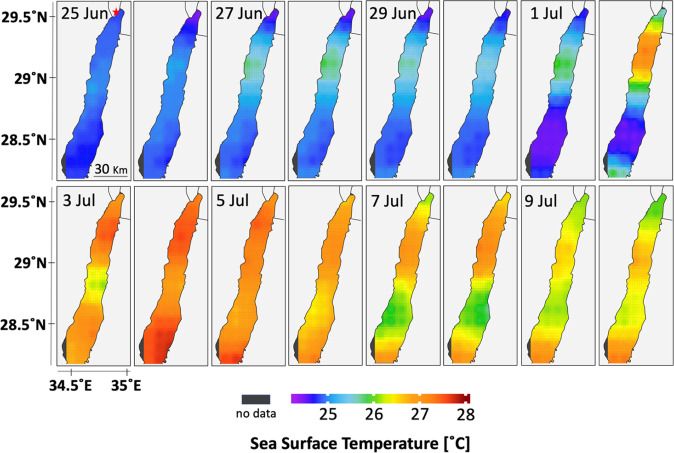
Fig. 6.
Remote sensing SST depicting daily changes over the Gulf of Aqaba from 25 June through 10 July 2017, showing the extreme Ronset of the first warming event (1 to 4 July). The satellite-derived SST values agreed remarkably well with the daily means of direct measurements of water temperature at the IUI pier (SI Appendix, Fig. S8A). The small red star at the top of the Upper Left panel indicates the location of the IUI. Note that the maximum temperature shown here for 4 July (∼27.5 °C) is lower than the maximum seen in Fig. 1A (28.6 °C) because the latter was obtained from measurements taken every 10 min, thereby recording the true maximum of the day, usually occurring in late afternoon. The spatial characteristics of the onset of the second warming event (14 to 16 July) were similar (SI Appendix, Fig. S8A).

