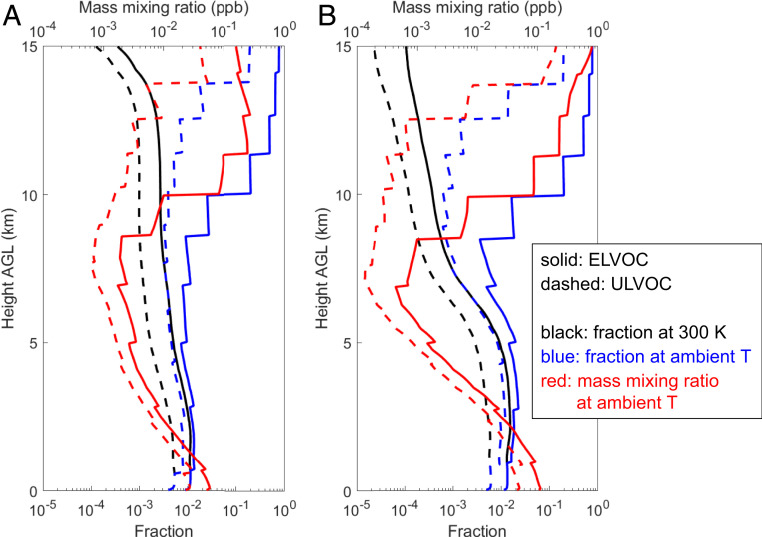
Fig. 3.
Production and abundance of ULVOC and ELVOC. Averaged mass mixing ratio of ULVOC and ELVOC (red lines) and their fractions in all monoterpene oxidation products (black and blue lines) as a function of height during the (A) wet season and (B) dry season periods. Here ULVOC and ELVOC only refer to those with O:C >0.4 that drive organic-mediated NPF. The black lines are the fractions of ULVOC and ELVOC when ULVOC/ELVOC at all heights are defined based on their volatility at 300 K. The blue lines are the fractions of ULVOC and ELVOC in the temperature at which the air masses are located. The ULVOC/ELVOC mixing ratios and fractions are calculated by summing gas- and particle-phase compositions in the atmosphere, which approximately represents all ULVOC/ELVOC that have been formed from monoterpene oxidation. A similar figure for a larger height range (0 to 20 km) is provided in SI Appendix, Fig. S8.

