
Figure 2.
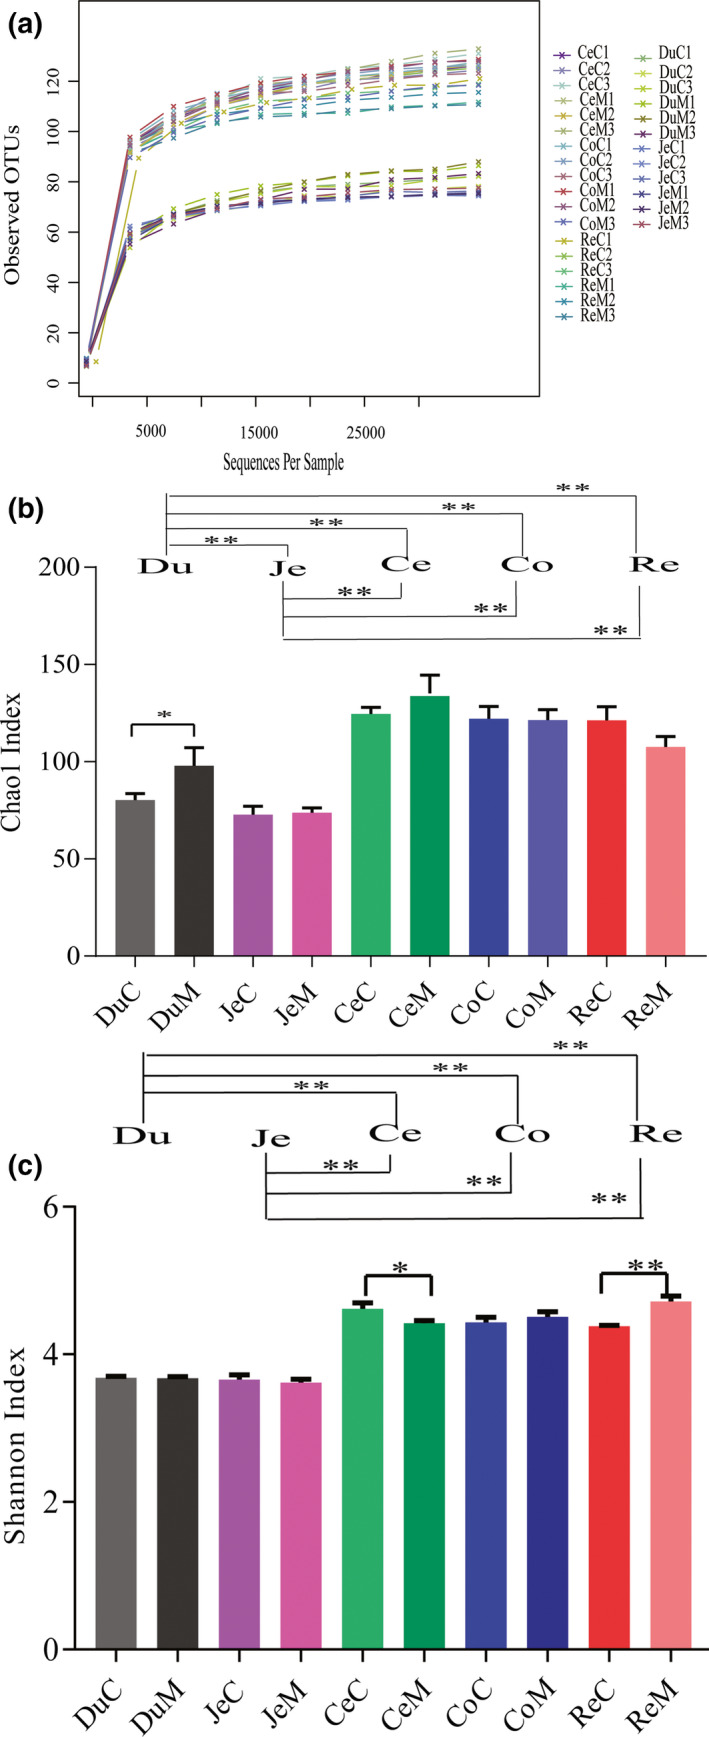
(a) Rarefaction curves for each sample from different ITSs of Balaenoptera acutorostrata. Comparison of Chao1 (b) and Shannon (c) indices of B. acutorostrata ITSs microbiota. Tukey's HSD test was used to determine significance among different ITSs samples. ** indicates a p‐value <0.05. The names of each sample are duodenum (Du), jejunum (Je), cecum (Ce), colon (Co), and rectum (Re) contents(C) or mucosa (M) with the serial number of 1 to 3.