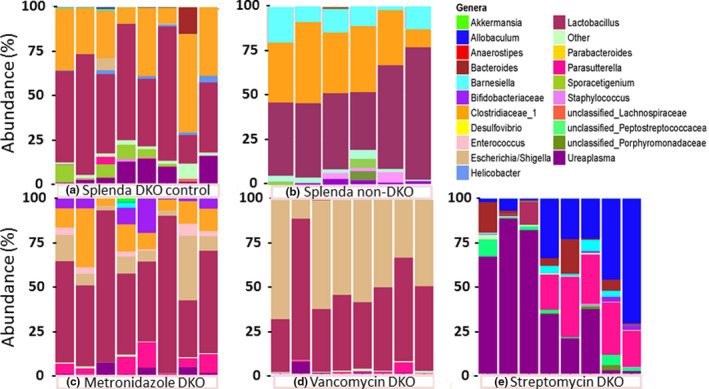
FIGURE 3.

The microbiome of the Splenda control (panel a DKO; Splenda non‐DKO panel b) and antibiotic treated sets (panels c‐e; metronidazole, vancomycin, and streptomycin). Abundances of OTUs of each mouse are shown in a single column as a color spectrum portrayal generally at the genus level; exceptions noted for Clostridiaceae for which cluster 1 is shown and unclassified Lachnospiraceae, Peptostreptococcaceae, and Porphyromondaceae, which represent families. Bacteria OTU color codes are shown top to bottom in the same order as the color key—alphabetical). Table 1 provides the mean abundances for each OTU
