
FIGURE 4.
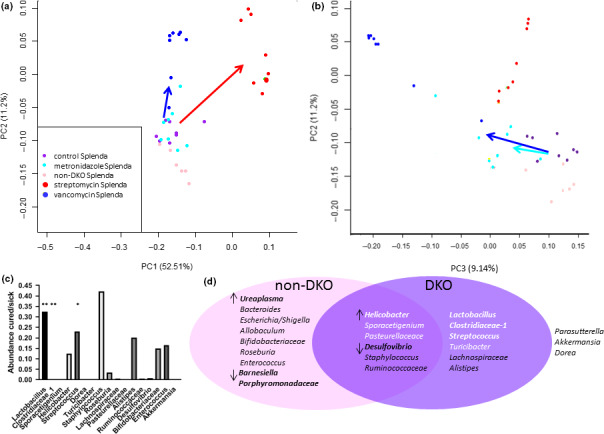
Results of 3 analyses for candidate provocative and beneficial OTUs. Principal component analysis of OTUs showing clustering of mice from Splenda DKO, non‐DKO, and antibiotic‐treated groups. This is based on Jaccard distances using abundance data. Panel a shows PC1 and PC2. Colored arrows indicate diverse microbiome groupings created by antibiotics relative to the Splenda DKO control; dark blue—vancomycin; red—streptomycin. Panel b has results for PC2 and PC3 and shows that non‐DKO mice remained grouped with the Splenda DKO control while the metronidazole group is slightly distanced (light blue arrow). Panel c represents the assessment provocative of OTUs (abundance in low pathology mice ÷sick mice <1). Statistical significance in pairwise t tests was found for an abundance of 3 OTUs (* and **). None passed adjustment for multiple samples. The best 2 OTU candidates are indicated by **. Panel d groups candidate OTUs based on contraction in DKO vs non‐DKO (↓) or expansion (↑) (statistically significant differences indicated by bold type), moderate to strong correlation with pathology markers (DKO purple oval stronger candidates in white letters; bold type for best candidates) or both (overlapping pink and purple ovals). The best candidates based on correlation are in bold white. The best consensus candidates are in whites letters and indicated by ↑ in the overlapping region. 3 OTUs found in Table 1 fall outside of both classifications. Data for results shown in panels c and d are found in Supporting Data Files