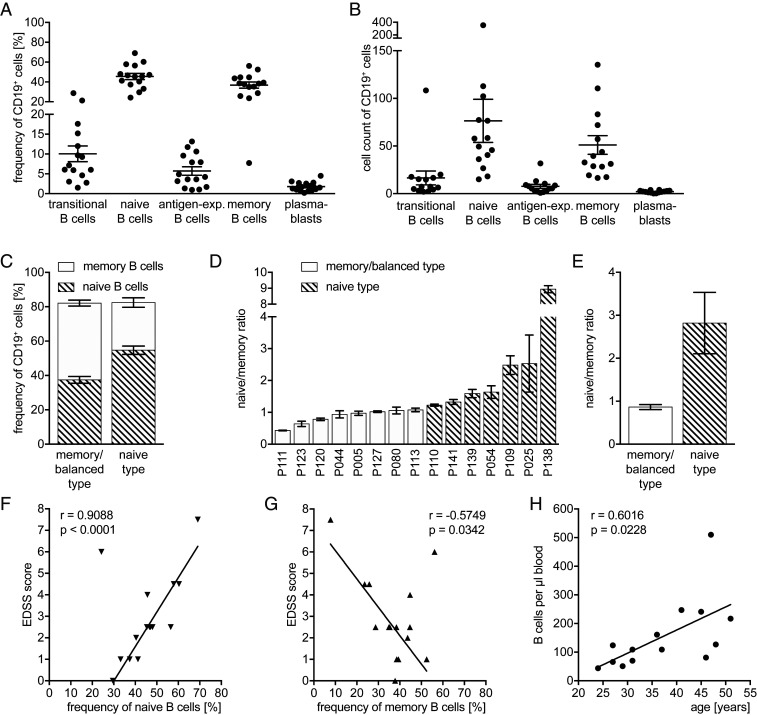
Fig. 1.
Individual B cell phenotype before therapy administration. Peripheral blood mononuclear cells were isolated from 15 MS patients before anti-CD20 antibody treatment was initiated (filled shapes, before depletion; n = 15 samples). Depicted are dot plots showing the mean ± SEM. Frequencies (A) and cell counts (B) of transitional (CD24high CD38high), mature naive (CD27− CD38+), antigen-experienced (=antigen-exp.; CD27+ CD38+), and memory (CD27var CD38−) B cells as well as plasmablasts (CD20− CD27+ CD38+) pre-gated on CD19+ B cells; frequency of transitional B cells and plasmablasts was gated within the mature naive respectively antigen-experienced B cells and was calculated to the B cell population. Second, frequency of transitional B cell and of plasmablasts was subtracted from mature naive respectively antigen-experienced B cells to receive the negative population. (C) Frequency of naive and memory B cells of all patients divided into two groups based on the naive/memory ratio. (D) Naive/memory ratio of every single patient in an increasing order and (E) mean naive/memory ratio of all patients, both (E and F) divided into two groups based on the naive/memory ratio (in memory/balanced type, ratio ≤ 1; in balanced type, the difference between the frequencies of naive and memory B cells must not exceed 5%; in naive type, ratio > 1). (F) Correlation between frequency of naive B cells before and EDSS score before treatment initiation (linear regression, Spearman r; when n = 15: r = 0.5938, P = 0.0216). (G) Correlation between frequency of memory B cells before and EDSS score before treatment initiation (linear regression, Spearman r; when n = 15: r = −0.3234, P = 0.2385). Correlation between B cell counts before first anti-CD20 antibody administration with age (H; n = 14); linear regression, Pearson r.

