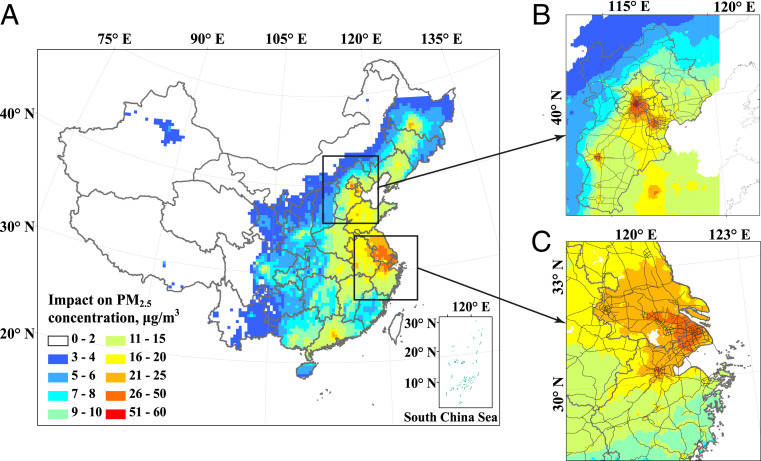
Fig. 2.
Geographic distribution of the impacts of vehicle control programs since 1998 on annual spatial average PM2.5 concentrations of China (A), BTH (B), and YRD (C) in 2015. The resolution of China is at 36 km × 36 km, while BTH and YRD are at a resolution of 4 km × 4 km. The data of impacts represent the projected difference between with- and without-control scenarios. Positive values imply the actual (i.e., with controls) PM2.5 concentrations in that year are lower than they would have been without controls, and vice versa.

