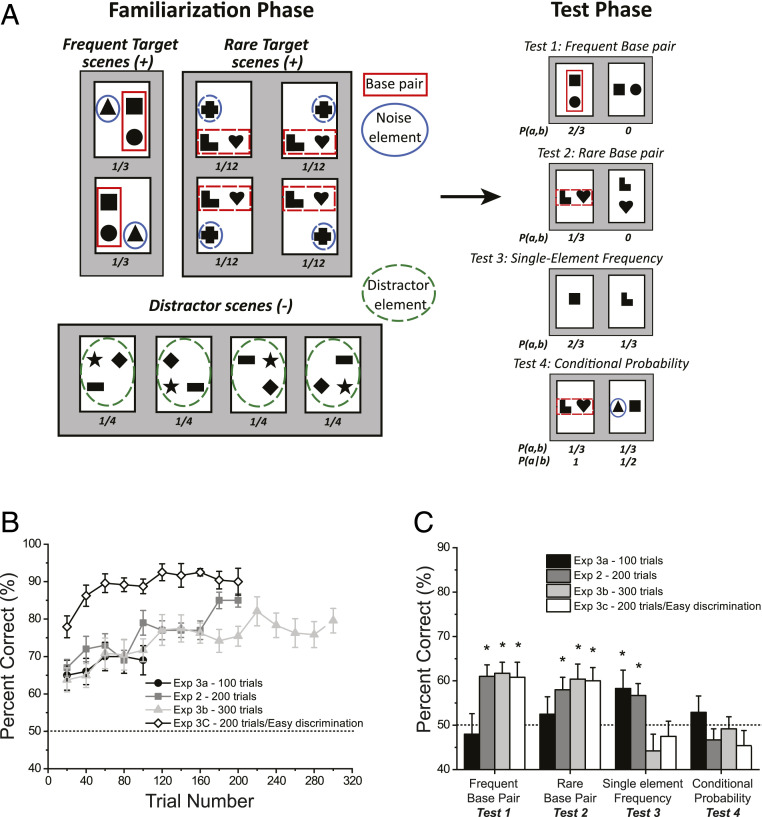
Fig. 3.
The design and results of Exps. 2 and 3a–c with honey bees. (A, Left) The Target and Distractor visual stimuli. (Right) Representative examples of the Target (Left) and Distracter stimuli (Right) in the four test types in Exp. 2. Numbers under stimuli report relative frequencies of occurrence. Red and blue solid and green dashed outlines were not presented in the original stimuli. (B) Mean improvement of performance during familiarization across Exps. 2 and 3a–c. (C) Average performance in the four tests (x axis) across Exps. 2 and 3a–c (see legend). Dashed line signals chance performance, error bars show SEM; *P < 0.05.

