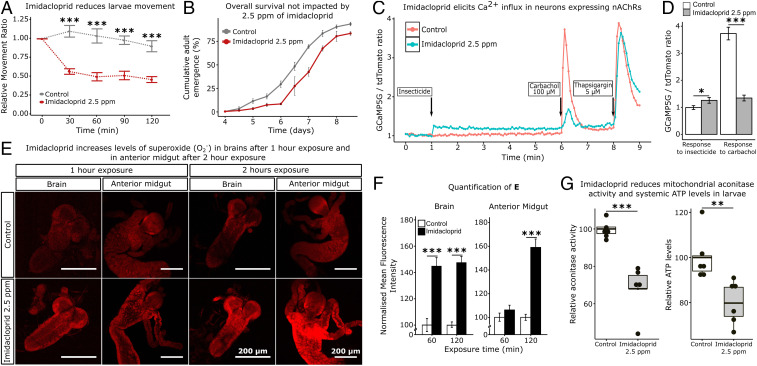
Fig. 1.
Imidacloprid impacts are initiated in the brain. (A) Dose–response to insecticide by an assay of larval movement over time, expressed in terms of relative movement ratio (RMR); n = 100 larvae/treatment). (B) Cumulative adult emergence (%) following larval exposure to 2.5 ppm imidacloprid for 2 h (n = 100 larvae/treatment). (C) Ca2+ influx measured by GCaMP in neuronal cells expressing nAChR. Measurement is expressed in terms of GCaMP5G signal divided by tdTomato constitutive expression. After 1 min the imidacloprid group was exposed to a 2.5 ppm of the insecticide. At 6 min and 8 min the imidacloprid and control groups were exposed to 100 µM carbachol and 5 µM thapsigargin, respectively. Each point represents the average of at least 50 cells. (D) Ca2+ influx, peak responses to imidacloprid and carbachol. (E) Superoxide levels in the brain and anterior midgut of larvae exposed to 2.5 ppm imidacloprid for either 1 h or 2 h. Tissue stained with DHE. Images obtained in Leica SP5 laser scanning confocal microscope, 200× magnification. (F) Normalized mean fluorescence intensity (n = 15 larvae/treatment; 3 sections/larva). (G) Relative mitochondrial aconitase activity (n = 25 larvae/replicate; 6 replicates/treatment) and relative ATP levels (n = 20 larvae/replicate; 6 replicates/treatment) in whole larvae after exposure to 2.5 ppm imidacloprid for 2 h. Error bars in A, B, D, and F represent mean ± SEM t test; *P < 0.05; **P < 0.01; ***P < 0.001. No significant difference found in B (Kolmogorov–Smirnov test; P > 0.05).

