Fig. 4.
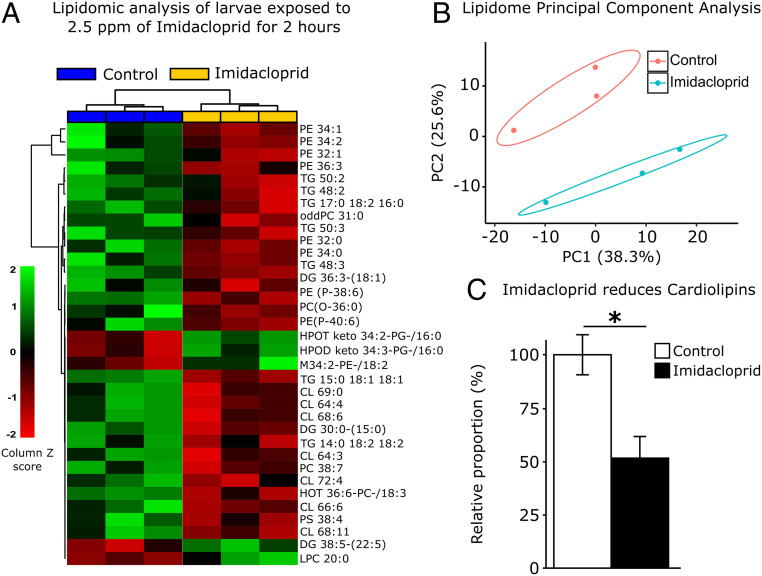
Imidacloprid disturbs lipid profiles of exposed larvae. Lipidomic profile of larvae exposed to 2.5 ppm imidacloprid for 2 h (n = 10 larvae/replicate; 3 replicates/treatment). (A) A total of 34 lipid species out of 378 were significantly affected by insecticide treatment (one-way ANOVA, Turkey’s honestly significant difference [HSD], P < 0.05). The column Z score is calculated subtracting from each value within a row the mean of the row and then dividing the resulting values by the SD of the row. The features are color coded by row, with red indicating low intensity and green indicating high intensity. (B) Principal component analysis of 378 lipid species. Each dot represents the lipidome data sum of each sample. First component explains 38.3% of variance and second component explains 25.6% of variance. (C) Relative proportion of cardiolipins in exposed animals versus control. Error bars represent mean ± SEM t test; *P < 0.05.

