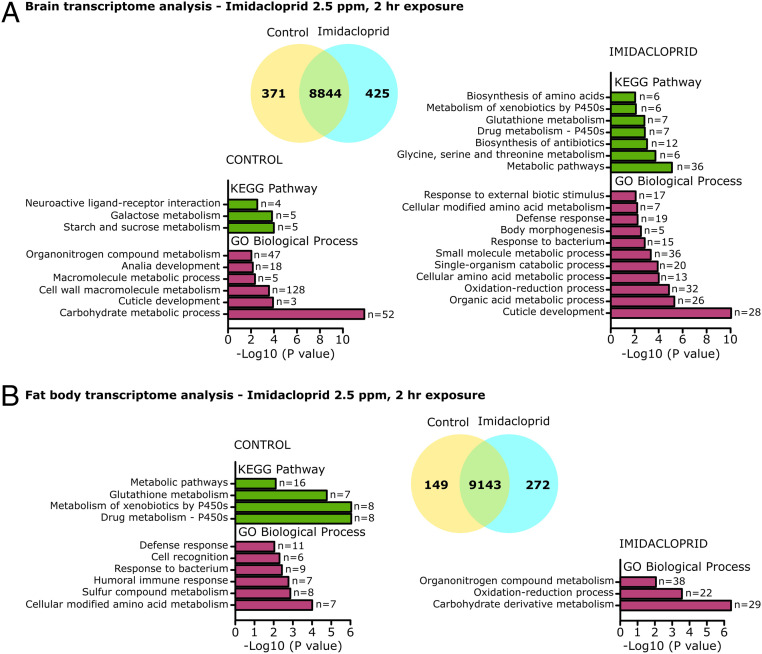
Fig. 5.
Transcriptomic analysis of the brain and fat body of larvae acutely exposed to imidacloprid. Third instar larvae exposed to 2.5 ppm imidacloprid for 2 h (n = 40 larvae/sample; 3 samples/treatment). (A) Transcriptomic analysis of brains, 371 genes down-regulated, and 425 genes up-regulated in imidacloprid samples (foldchange > |2|, P adj < 0.05). (B) Transcriptomic analysis of fat body, 149 genes down-regulated, and 272 genes up-regulated in imidacloprid samples (foldchange > |2|, P adj < 0.05). KEGG and Gene Ontology analysis were performed in DAVID (Bioinformatics Resources 6.8), the modified Fisher exact P value was transformed using −log (10) scale. The “n” values in front of the bars indicate the number of genes associated to each KEGG Pathway or GO biological process in the dataset.

