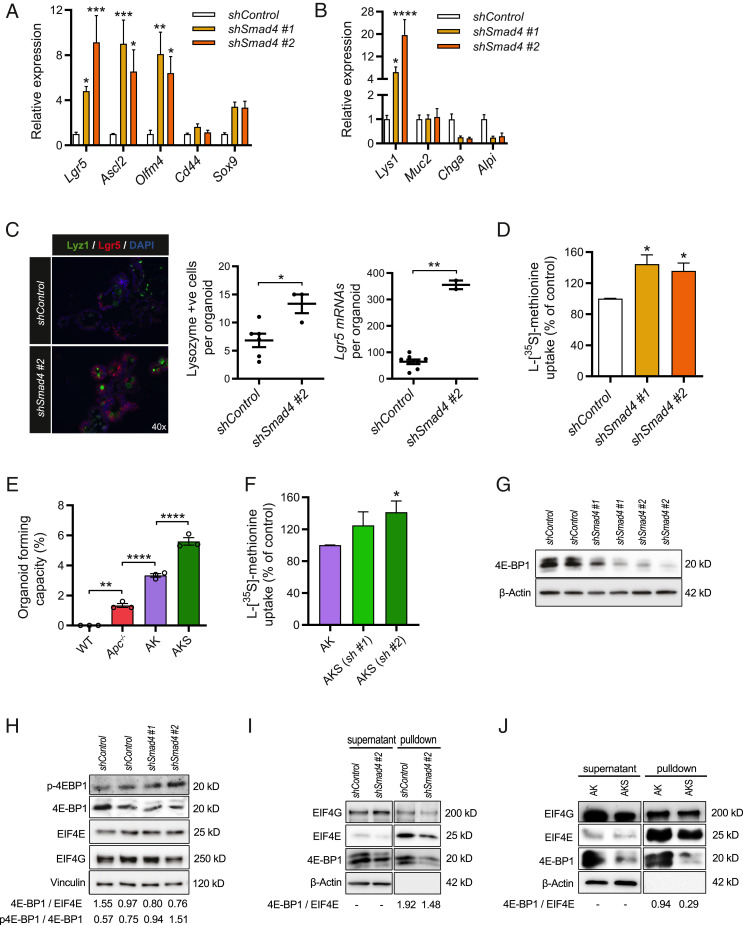
Fig. 2.
Knockdown of Smad4 results in enrichment of the stem and Paneth cell compartments, which is accompanied by increased global translation and reduced expression of translational repressor 4E-BP1. (A) Quantitative RT-PCR analysis of crypt base columnar stem cell markers in shSmad4 organoids (n = 3). (B) Analysis of small intestinal differentiation markers in shSmad4 organoids (n = 3). (C) Combined staining of in situ hybridization of stem cell marker lgr5 and immunostaining for Paneth cell marker lysozyme in shSmad4 organoids, including quantification of the mRNA particles and lysozyme-positive cells per organoid. *P < 0.05, Student’s t test. (D) l-[35S]-methionine incorporation assay of shSmad4 organoids assessed at day 4 after passaging (n = 3). (E) Clonogenic capacity of single cells that grow out to fully developed organoids, presented as a quantification of the organoid number per 20,000 seeded cells (n = 3). (F) l-[35S]-methionine incorporation assay in Apc−/− Kras+/G12D shSmad4#2 (AKS) and Apc−/− Kras+/G12D shControl (AK) organoids assessed at day 3 after passaging (n = 4). (G) Representative immunoblotting analysis of 4E-BP1 expression in shSmad4 organoids. β-Actin served as a loading control (n = 3). (H) Representative immunoblotting analysis of phospho-4E-BP1 (Thr70), eIF4E, and eIF4G in shSmad4 organoids. Optical density ratios of phospho-4E-BP1/4E-BP1 and 4E-BP1/eIF4E were also calculated (n = 2). (I) m7GTP-agarose pulldown assay in shSmad4 organoids to assess the levels of cap-bound eIF4E, eIF4G, and 4E-BP1 (n = 3). Unbound levels of β-actin 4E-BP1 and eIF4G were detected in supernatants. (J) m7GTP-agarose pulldown assay comparing AKS (shSmad4 #2) to AK organoids (shControl) (n = 3). Data are represented as means ± SEM. Significance (one-way ANOVA) *P < 0.05, **P < 0.01, ***P < 0.001, ****P < 0.0001.

