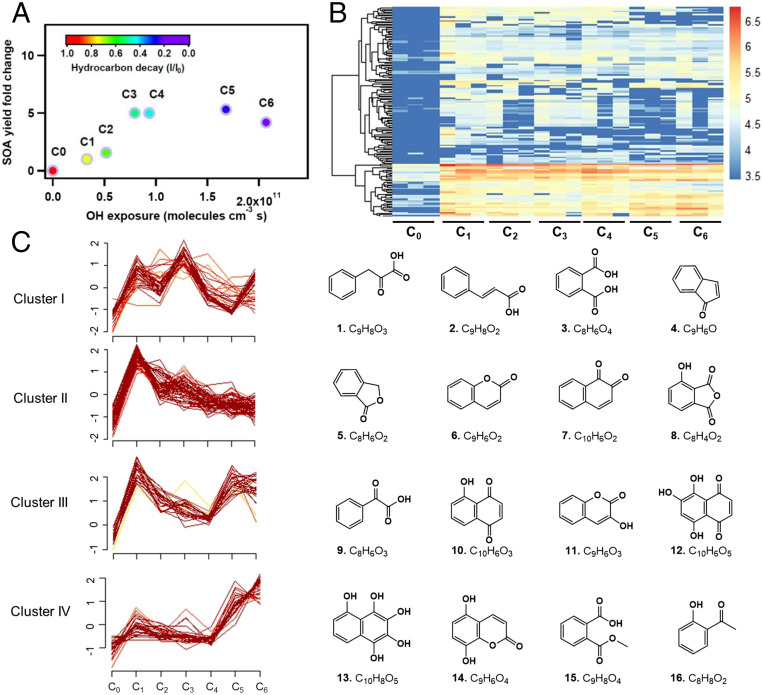
Fig. 1.
Dynamic changes in chemical composition of NSOA upon atmospheric aging. (A) Variation in NSOA yields under different OH exposure conditions. The color of each marker indicates the extent of hydrocarbon precursor decay, which was nearly complete in C6. (B) Hierarchical clustering of the 156 NSOA chemicals detected by LC-Orbitrap. Four major clusters were identified. The colors indicate log-transformed peak intensities. (C) Evolution of the four clusters under different OH exposure conditions. Molecular structures are shown for four representative chemicals detected in each cluster. The centralization of compounds is indicated from dark to light colors. The y axis represents the normalized abundances standardized to have a mean of zero and a SD of 1.

