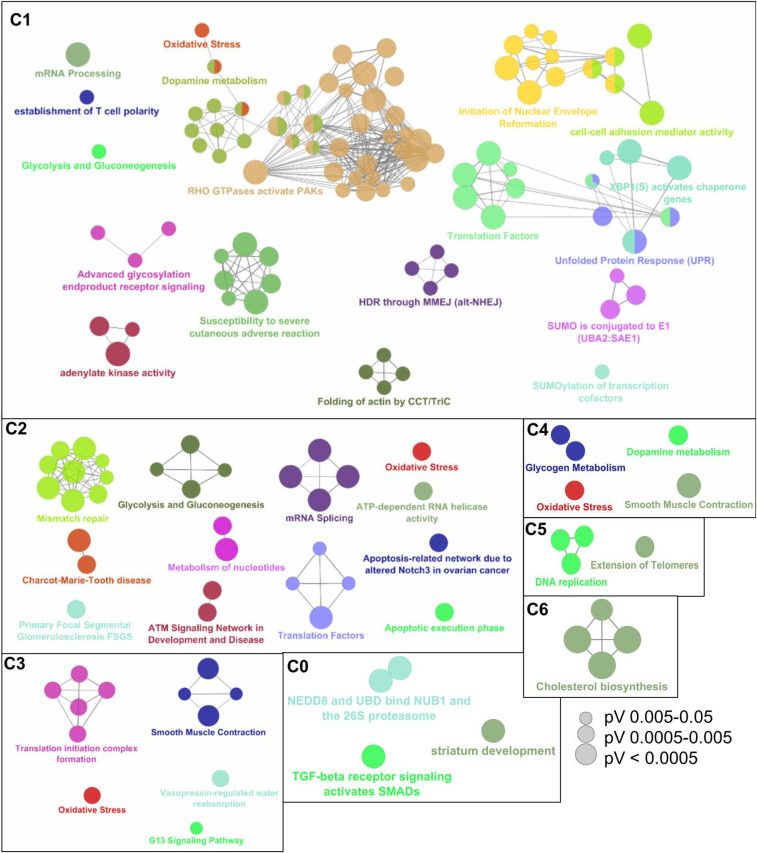
Fig. 3.
Pathway enrichment analysis of proteins that were significantly altered by NSOA. The annotation network of significantly altered pathways was visualized by ClueGO, which is a Cytoscape plug-in. Each circle represents a biological term consisting of various related genes. Terms that pertain to the same pathway are displayed with the same color, and terms associated with two different pathways are shown in two-tone. The connectivity (edges) between the terms in functionally grouped network is derived from kappa score, which indicates the similarity of associated genes shared by different terms, and thicker edges indicate stronger similarity. The size of the circles positively correlates with statistical significance of the term enrichment. Only the name of the most significant term in each group is shown to reduce overlay.

