Fig. 2.
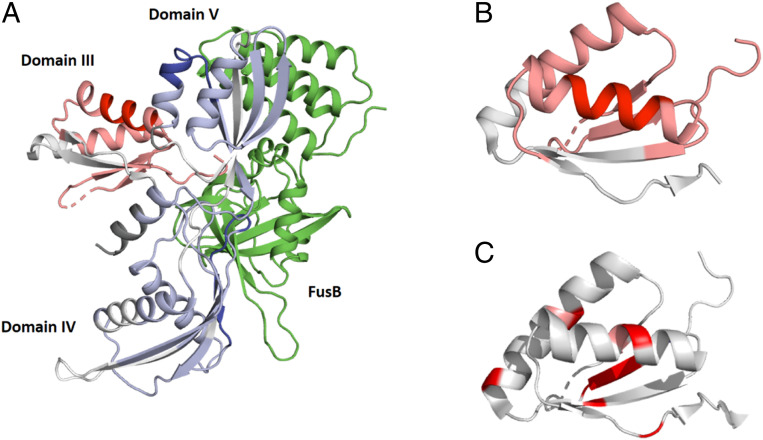
Comparison of hydrogen exchange mass spectrometry data in EF-GC3 in the apo- and FusB-bound states. (A) Regions of EF-GC3 that are protected (blue) or deprotected (red) from exchange in the presence of FusB are shown in the structure of the FusB:EF-GC3 complex (12) (PDB ID: 2MZW). The structure of domain III is modeled on the basis of the EF-G apo structure (24) (PDB ID: 2XEX) as no structure of this domain in the FusB-bound complex is available (12). Domains IV and V are protected from exchange upon FusB binding, particularly in the regions that contact FusB, while domain III becomes deprotected throughout the domain. FusB is shown in green. (B and C) Comparison of regions within domain III showing HX-MS deprotection. SI Appendix, Fig. S3 (B and C) Comparison of regions within domain III showing HX-MS deprotection (B) with residues showing relaxation dispersion effects upon FusB binding (C). (B) Dark red indicates greater levels of deprotection, as shown in SI Appendix, Fig. S3. (C) Residues colored red undergo dispersion in CPMG experiments in EF-GC3 bound to FusB. Both significant deprotection and relaxation dispersion occur in the center of the domain, suggesting that they reflect the same change. Data in B and C are shown on the structure of apo EF-G (24) (PDB ID: 2XEX) as no structure of this domain in the presence of FusB is available (12).

