Fig. 3.
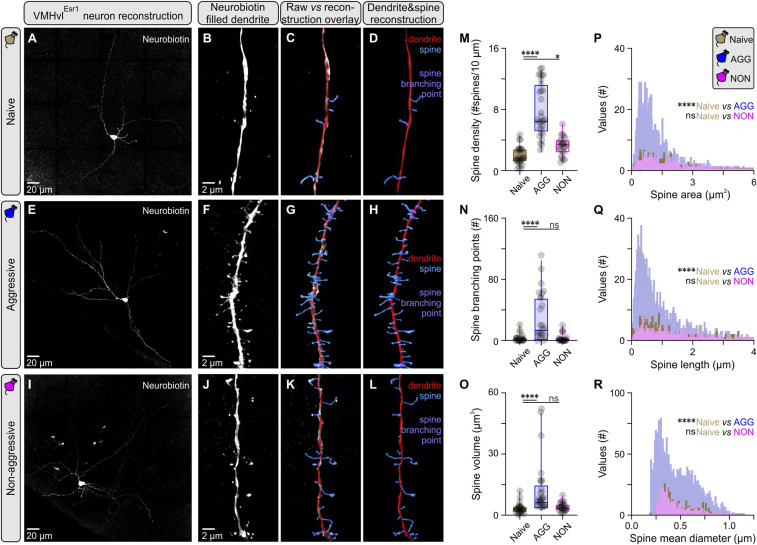
Increased dendritic spine complexity in VMHvlEsr1 neurons following aggression training. (A) Maximum projection confocal image of a VMHvlEsr1 neuron from a socially naive mouse recorded ex vivo, and filled with Neurobiotin. (B) Three-dimensional (3D) rendering of a second order dendritic segment Airyscan image from the neuron presented in A. (C) Overlay of reconstruction data generated in Imaris against 3D rendering for the dendritic segment presented in B. (D) Reconstructed dendritic segment of a VMHvlEsr1 neuron from a socially naive mouse, with color coding for the dendrite and spines. (E) Maximum projection confocal image of a VMHvlEsr1 neuron from an aggressive (AGG) mouse recorded ex vivo, and filled with Neurobiotin. (F) A 3D rendering of a second order dendritic segment Airyscan image from the neuron presented in E. (G) Overlay of reconstruction data generated in Imaris against 3D rendering for the dendritic segment presented in F. (H) Reconstructed dendritic segment of a VMHvlEsr1 neuron from an AGG mouse, with color coding for the dendrite and spines. (I) Maximum projection confocal image of a VMHvlEsr1 neuron from a nonaggressive (NON) mouse recorded ex vivo, and filled with Neurobiotin. (J) A 3D rendering of a second order dendritic segment Airyscan image from the neuron presented in I. (K) Overlay of reconstruction data generated in Imaris against 3D rendering for the dendritic segment presented in J. (L) Reconstructed dendritic segment of a VMHvlEsr1 neuron from a NON mouse, with color coding for the dendrite and spines. (M) Quantification of spine density in second order dendrites of VMHvlEsr1 neurons from socially naive, AGG, and NON mice (n = 3 to 5 cells per group, n = 1 cell per brain slice per animal, n = 23 to 26 segments analyzed per group, Kruskal–Wallis one-way ANOVA with Dunn’s post hoc test, P < 0.0001 between socially naive and AGG mice, P = 0.0432 between socially naive and NON mice). (N) Quantification of branching points in second order dendrites of VMHvlEsr1 neurons from socially naive, AGG, and NON mice (n = 23 to 26 segments analyzed per group, Kruskal–Wallis one-way ANOVA with Dunn’s post hoc test, P < 0.0001 between socially naive and AGG mice, P = 0.9969 between socially naive and NON mice). (O) Quantification of spine volume in second order dendrites of VMHvlEsr1 neurons from socially naive, AGG, and NON mice (n = 23 to 26 segments analyzed per group, Kruskal–Wallis one-way ANOVA with Dunn’s post hoc test, P < 0.0001 between socially naive and AGG mice, P = 0.4640 between socially naive and NON mice). (P) Frequency distribution plot of spine area, of spines present in second order dendrites in VMHvlEsr1 neurons from socially naive, AGG, and NON mice (n = 3 to 5 cells per group, n = 1 cell per brain slice per animal, n = 402 to 2,365 spines per group). (Q) Frequency distribution plot of spine length, of spines present in second order dendrites in VMHvlEsr1 neurons from socially naive, AGG, and NON mice (n = 402 to 2,365 spines per group). (R) Frequency distribution plot of spine mean diameter, of spines present in second order dendrites in VMHvlEsr1 neurons from socially naive, AGG, and NON mice (n = 402 to 2,365 spines per group). ns, not significant; *P < 0.05, ****P < 0.0001. In box plots, the median is represented by the center line, the interquartile range is represented by the box edges, the bottom whisker extends to the minimal value, and the top whisker extends to the maximal value.

