Fig. 4.
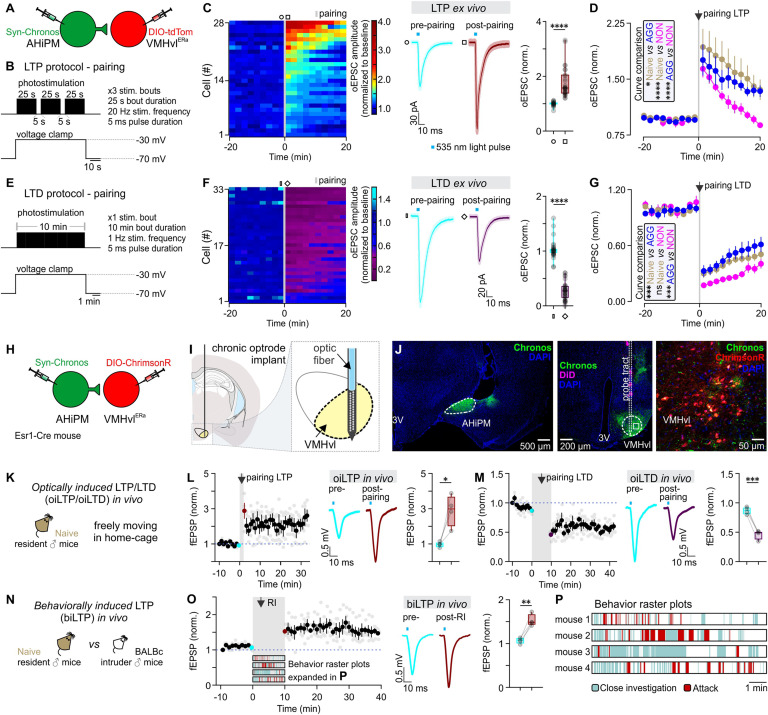
Induction of LTP and LTD at AHiPM→VMHvlEsr1 synapses ex vivo and in vivo. (A) Schematic of the experimental design used to study the induction of LTP and LTD ex vivo in socially naive, aggressive (AGG) and nonaggressive (NON) mice. (B) Illustration of the experimental protocol used to induce LTP in the AHiPM→VMHvl synapse. (C, Left) Heat map illustrating the magnitude of LTP induction in all recorded VMHvlEsr1 neurons. (Middle) Average current immediately prior to and following the induction of LTP (Middle, n = 28 neurons collected from the three groups—socially naive, AGG, and NON, with n = 6 to 8 mice per group, light color envelope is the SE). (Right) Quantification of the optically evoked excitatory post-synaptic current (oEPSC), prior to and following the induction of LTP (pre- vs. postpairing, n = 28 neurons collected from the three groups—socially naive, AGG, and NON, with n = 6 to 8 mice per group, two-tailed Wilcoxon signed-rank test, P < 0.0001). (D) Identification of differences in amplitude and persistence of LTP in socially naive, AGG, and NON mice (n = 9 neurons for six socially naive mice, n = 10 neurons from eight AGGs, and n = 9 neurons from six NONs, Kolmogorov–Smirnov test for curve comparison, P = 0.0183 between socially naive and AGG mice, P < 0.0001 between socially naive and NON mice, and P < 0.0001 between AGG and NON mice). (E) Illustration of the experimental protocol used to induce LTD in the AHiPM→VMHvl synapse. (F, Left) Heat map illustrating the magnitude of LTD induction in all recorded VMHvlEsr1 neurons. (Middle) Average current immediately prior to and following the induction of LTD (Middle, n = 33 neurons collected from the three groups—socially naive, AGG, and NON, with n = 8 mice per group, light color envelope is the SE). (F, Right) Quantification of the oEPSC, prior to and following the induction of LTD (pre- vs. postpairing, n = 33 neurons collected from the three groups—socially naive, AGG, and NON, with n = 8 mice per group, two-tailed Wilcoxon signed-rank test, P < 0.0001). (G) LTD dynamics in the three groups (n = 12 neurons for eight socially naive mice, n = 10 neurons from eight AGGs, and n = 11 neurons from eight NONs, Kolmogorov–Smirnov test for curve comparison, P = 0.0002 between socially naive and AGG mice, P > 0.9999 between socially naive and NON mice, and P = 0.0008 between AGG and NON mice). (H) Schematic of the experimental design used to study the induction of LTP and LTD in vivo in socially naive mice. (I) Schematic illustration of the target coordinates of the optrode used to record local field potentials in VMHvl. (J, Left) Representative confocal image of Chronos-eYFP expression in AHiPM. (Middle) Representative confocal image of the silicon probe tract targeted to VMHvl. (Right) High magnification confocal image of VMHvl. (K) Illustration of the experimental design used to induce LTP or LTD in the AHiPM→VMHvl synapse in vivo. (L, Left) Plot of the average of four experiments from four mice of field EPSP slope (normalized to baseline period) before and after optically induced LTP (oiLTP). (Middle) In vivo average field response prior to and following the induction of LTP. (Right) Quantification of optically induced fEPSPs, prior to and following the induction of LTP (pre- vs. postpairing, n = 4 mice per group, two-tailed paired t test, P = 0.0283). (M, Left) Plot of the average of four experiments from four mice of fEPSP slope (normalized to baseline period) before and after oiLTD. (Middle) In vivo average field response prior to and following the induction of LTD. (Right) Quantification of optically induced fEPSPs, prior to and following the induction of LTD (pre- vs. postpairing, n = 4 mice per group, two-tailed paired t test, P = 0.0007). (N) Illustration of the experimental design used to test the behavioral induction of LTP. (O, Left) Plot of the average of four experiments from four mice of fEPSP slope (normalized to baseline period) before and after behaviorally induced LTP (biLTP). (Middle) In vivo average field response prior to and following the behavioral induction of LTP. (Right) Quantification of optically induced fEPSPs, prior to and following social behavior experience in a socially naive mouse (pre- vs. postpairing, n = 4 mice per group, two-tailed paired t test, P = 0.0071). (P) Illustration of the behaviors expressed in the resident–intruder assay from socially naive mice used for the in vivo study of hypothalamic LTP. ns, not significant; *P < 0.05, **P < 0.01, ***P < 0.001, ****P < 0.0001. In box plots, the median is represented by the center line, the interquartile range is represented by the box edges, the bottom whisker extends to the minimal value, and the top whisker extends to the maximal value.

