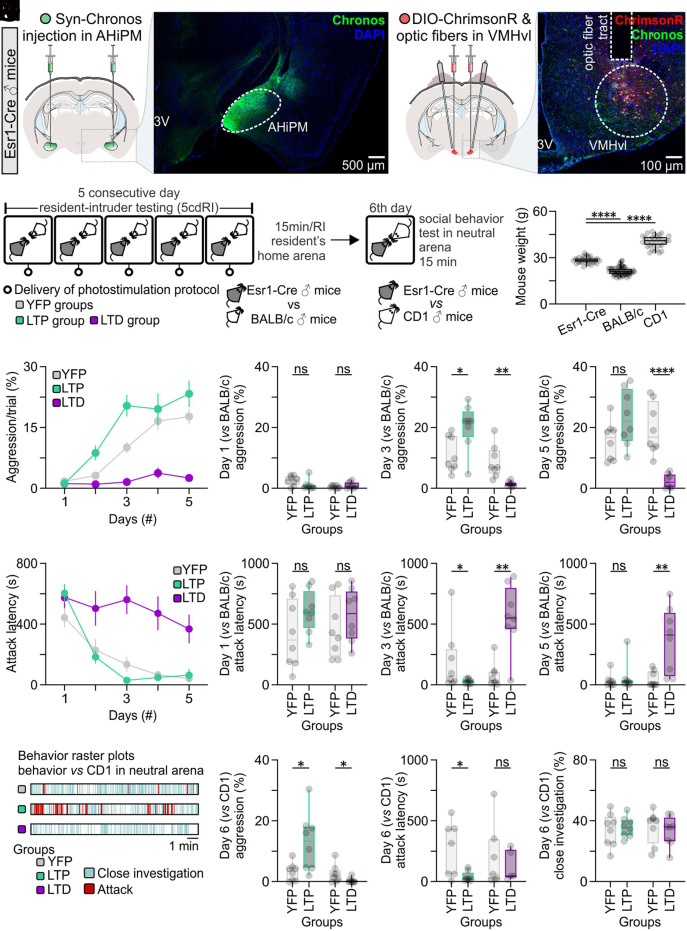
Fig. 5.
Optogenetic induction of LTP or LTD at AHiPM→VMHvlEsr1 synapses in vivo facilitates or abolishes, respectively, the effect of aggression training. (A, Left) Representative confocal image and schematic indicative of ChrimsonR expression in VMHvlEsr1 neurons, eYFP terminals of the AHiPM→VMHvl projection, and the optic fiber tract terminating above VMHvl. (Right) Representative confocal image and schematic indicative of Chronos-eYFP expression in AHiPM. (B) Schematic of the experimental design used to identify whether LTP and LTD have an impact on aggression training. (C) Weight measurements of the mice which were used in the protocol; specifically, the Esr1-Cre mice were used as residents, the BALB/c as intruders, and the CD1 as novel conspecifics in a novel/neutral arena (n = 32 to 64 mice per group, one-way ANOVA with Tukey’s test, P < 0.0001 between Esr1-Cre and BALB/c mice, P < 0.0001 between Esr1-Cre and CD1 mice). (D) Quantification of aggression levels expressed during a trial throughout the 5cdRI test in the YFP (control), LTP, and LTD groups. (E) Quantification of aggression levels on the first day of the 5cdRI test (n = 8 mice per group, two-tailed unpaired t test, P = 0.1049 between YFP and LTP groups, P = 0.2304 between YFP and LTD groups). (F) Quantification of aggression levels on the third day of the 5cdRI test (n = 8 mice per group, two-tailed unpaired t test, P = 0.0162 [observed power = 0.989, Cohen’s D = 0.7979, difference between means = 9.13 ± 3.34%, 95% CI = 1.966 to 16.29] between YFP [lower 95% CI = 6.452, higher 95% CI = 16.06] and LTP [lower 95% CI = 14.12, higher 95% CI = 26.65] groups, P = 0.0017 between YFP and LTD groups). (G) Quantification of aggression levels on the fifth day of the 5cdRI test (n = 8 mice per group, two-tailed unpaired t test, P = 0.0777 between YFP and LTP groups, P < 0.0001 between YFP and LTD groups). (H) Quantification of attack latency throughout the 5cdRI test in the YFP (control), LTP, and LTD groups. (I) Quantification of attack latency on the first day of the 5cdRI test (n = 8 mice per group, two-tailed unpaired t test, P = 0.1406 between YFP and LTP groups, P = 0.3688 between YFP and LTD groups). (J) Quantification of attack latency on the third day of the 5cdRI test (n = 8 mice per group, two-sided Mann–Whitney U test, P = 0.0415 [observed power = 0.999, Cohen’s D = 0.6072, difference between means = 159.40 ± 90.79 s, 95% CI = −378.8 to 60.04] between YFP [lower 95% CI = −21.05, higher 95% CI = 407.0] and LTP [lower 95% CI = 16.54, higher 95% CI = 50.56] groups, P = 0.0019 between YFP and LTD groups). (K) Quantification of attack latency on the fifth day of the 5cdRI test (n = 8 mice per group, two-sided Mann–Whitney U test, P = 0.5054 between YFP and LTP groups, two-tailed unpaired t test, P = 0.0052 between YFP and LTD groups). (L) Representative behavior raster plots of YFP, LTP, and LTD mouse behavior in a novel arena toward a novel CD1 conspecific. (M) Quantification of aggression levels on the sixth day against a CD1 male (n = 8 mice per group, two-tailed unpaired t test, P = 0.0387 [observed power = 0.999, Cohen’s D = 0.8980, difference between means = 9.816 ± 3.864%, 95% CI = 0.6784 to 18.95] between YFP [lower 95% CI = 0.8293, higher 95% CI = 5.768] and LTP [lower 95% CI = 5.190, higher 95% CI = 21.04] groups, two-sided Mann–Whitney U test, P = 0.0295 [observed power = 0.907, Cohen’s D = 0.7357, difference between means = 2.161 ± 1.069%, 95% CI = −4.616 to 0.2938] between YFP [lower 95% CI = 0.1860, higher 95% CI = 5.052] and LTD groups [lower 95% CI = −0.2284, higher 95% CI = 1.144]). (N) Quantification of attack latency on the sixth day against a CD1 male (n = 8 mice per group, two-tailed unpaired t test, P = 0.0328 [observed power = 0.985, Cohen’s D = 1.0431, difference between means = 227.00 ± 82.23 s, 95% CI = 25.81 to 428.2] between YFP [lower 95% CI = 67.01, higher 95% CI = 477.9] and LTP groups [lower 95% CI = 4.196, higher 95% CI = 86.63], two-sided Mann–Whitney U test, P > 0.9999 between YFP and LTD groups). (O) Quantification of close investigation on the sixth day against a CD1 male (n = 8 mice per group, two-tailed unpaired t test, P = 0.6973 between YFP and LTP groups, P = 0.6158 between YFP and LTD groups). ns, not significant; *P < 0.05, **P < 0.01, ****P < 0.0001. In box plots, the median is represented by the center line, the interquartile range is represented by the box edges, the bottom whisker extends to the minimal value, and the top whisker extends to the maximal value.

