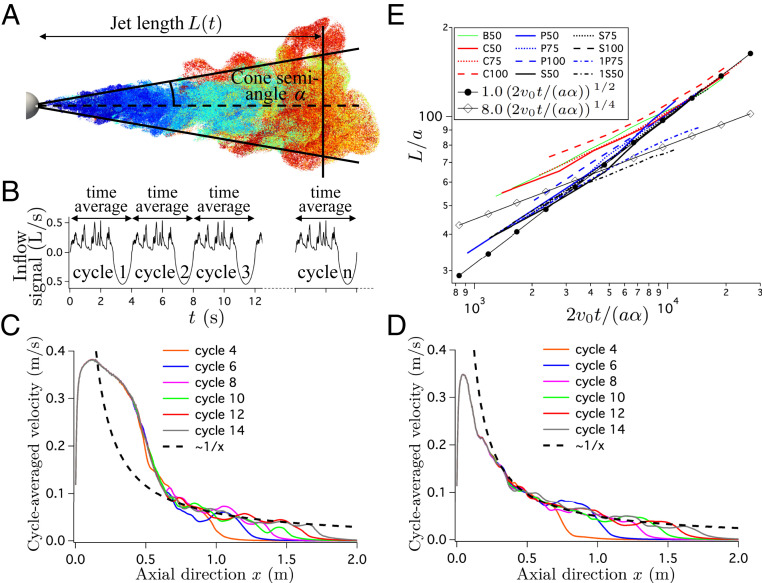
Fig. 5.
Jet characteristics in the simulation of the breathing and speaking signals shown in Fig. 4 A–D. (A) Example of calculation of jet length and angle for S75, based on the emitted tracer particles color coded here by residence time, as described in Fig. 4 E–H. is such that 90% of the particles are located upstream of at time . The cone angle is calculated to enclose 90% of the particles and is a cone passing through the mouth exit (radius is 1 cm at ). This angle is verified to remain stable with time after the initial cycles. (B) Principle of the calculation of the cycle-averaged velocity fields presented in C and D. The velocity is time averaged independently over each cycle. (C and D) Progressive formation, along increasing cycles of exhalation and inhalation, of a turbulent jet-like velocity profile in the far field. Examples of cases C50 (C) and S50 (D): cycle-averaged axial velocity along the axis from the mouth exit to 2.0 m downstream, for different cycles, extending to 14 cycles or 56 s. The black dashed line is the scaling, plotted here as a guide for the eye, which is suggested by a model of a steady turbulent jet. (E) Evolution of the nondimensional jet length as a function of (Eq. 2), with cm the equivalent radius of the mouth exit and the average axial speed during exhalation for the different simulations. Two power laws are plotted as a guide for the eye to assess the evolution of with time. Raw data for are plotted in SI Appendix, Fig. S2.

