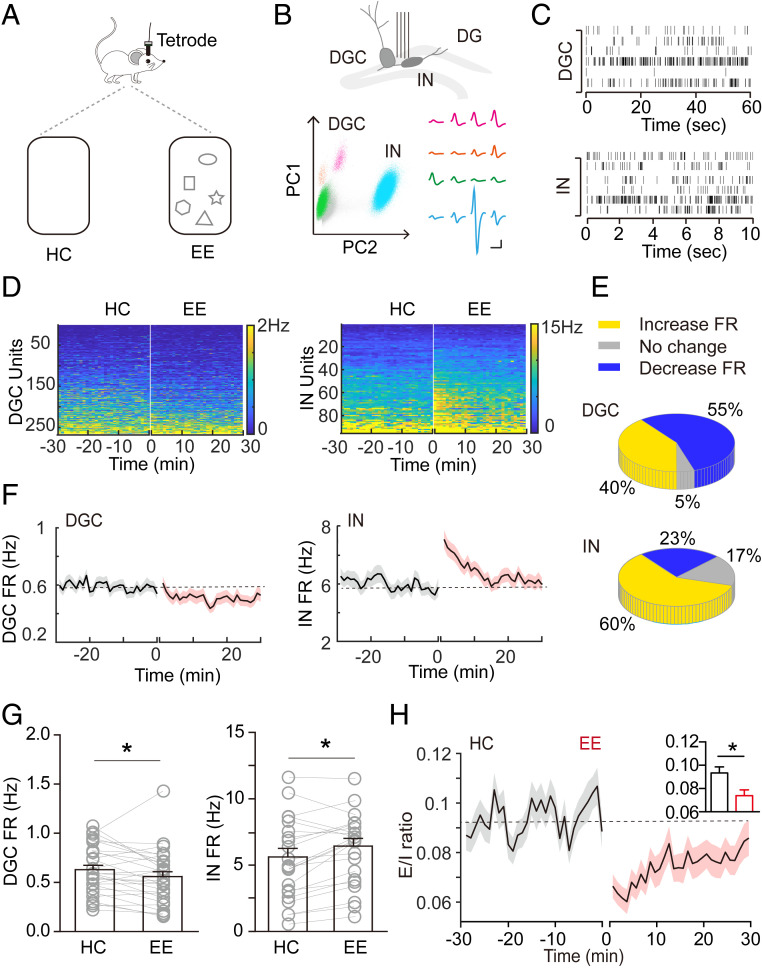
Fig. 1.
Activation of inhibitory and suppression of excitatory neural circuits in the dentate gyrus during hippocampus-engaged exploration. (A) Schematic drawings showing tetrode implantation and behavior conditions. (B) Schematic drawings showing the method of distinguishing between excitatory and inhibitory neurons: (Upper) tetrode implantation in the dentate gyrus; (Lower) representative waveforms of three DGC units and one interneuron (IN) unit. (Scale bar, 5 mV and 10 ms.) (C) Raster plots of DGC and IN unit activities. (D) Heatmaps representing the firing rate of individual units in HC and EE conditions. Units are sorted by their average 30-min firing rate during HC recording. (E) Distribution of DGCs and INs based on their average firing rate (FR). Average FR in the EE condition was defined as an “increase” or “decrease” when it changed by ≥5% relative to that in the HC condition, whereas “no change” was defined as change of <5%. (F) Change in average FR of all excitatory (n = 265; mice = 3) and inhibitory (n = 95; mice = 3) units over time. (G) Average FR of excitatory and inhibitory units in HC and EE conditions (*P < 0.05; RM-ANOVA). (H) E/I ratio in HC and EE conditions, calculated as fEX/fIN. Black lines indicate the mean value, and shaded areas indicate the SEM. Dashed gray line is the averaged E/I ratio of HC recording. *P < 0.05; RM-ANOVA.

