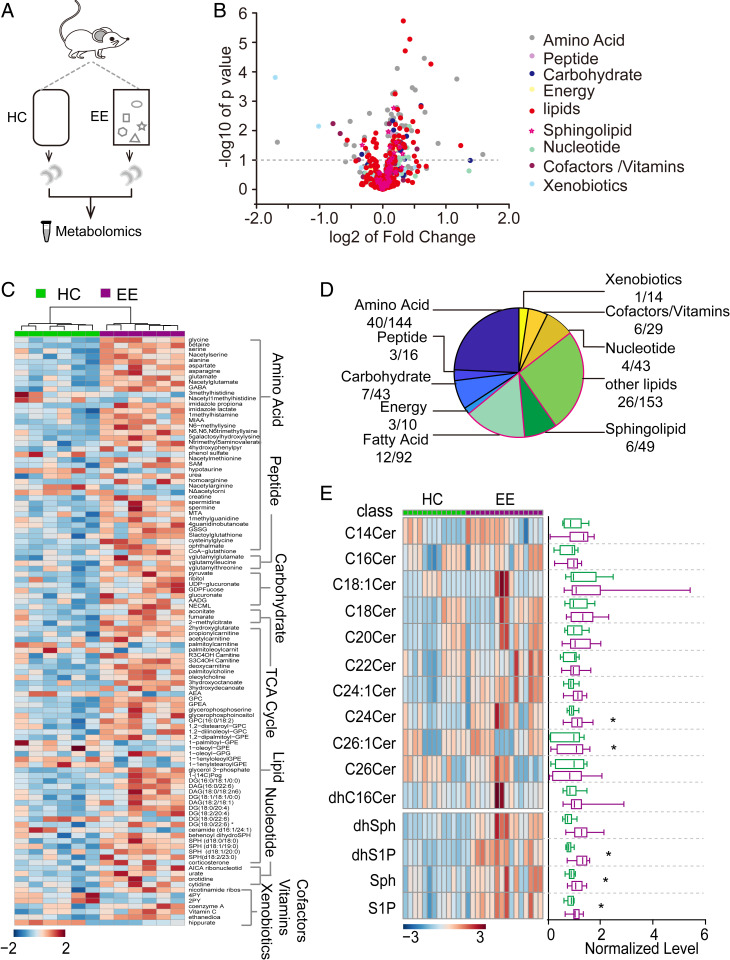
Fig. 3.
Metabolomics and lipidomics analyses reveal an increase in bioactive metabolite S1P during hippocampus-engaged exploration. (A) Schematic drawing of the experimental design for metabolomic analysis. (B) Volcano plot showing the fold-change and P value for all 593 metabolites between HC and EE conditions. Lipids, including sphingolipids, showed extensive changes between conditions (HC, n = 6; EE, n = 6; *P < 0.05; unpaired t test). (C) Hierarchical clustering heatmap showing metabolites with significant differences between HC and EE conditions grouped into seven major pathways. The lipid pathway was one of the primary pathways influenced by exploration. (D) Proportion of metabolites with significant differences (P < 0.05, unpaired t test) in each major pathway. (E, Left) Hierarchical clustering heatmap showing lipidomic analysis; (Right) mean values in HC and EE conditions (HC, n = 13; EE, n = 16; *P < 0.05; unpaired t test).

