Fig. 5.
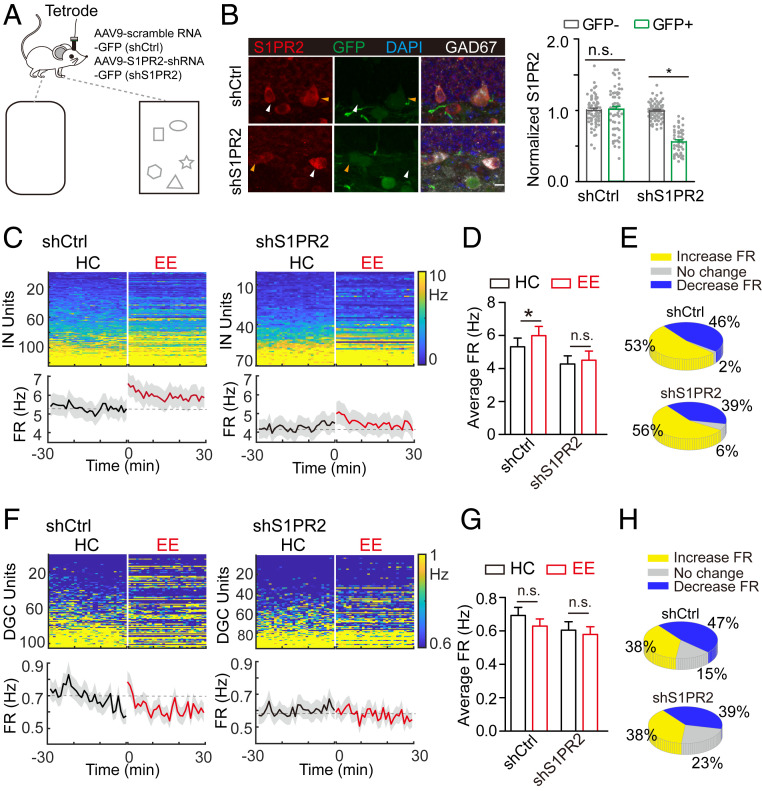
S1PR2 activation is necessary for exploration-induced neurogenesis. (A) Schematic diagram showing the experiment design. shS1PR2 was injected into the dentate gyrus to manipulate expression of S1PR2. (B) Validation of the knockdown efficiency of shS1PR2: (Left) representative images; (Right) quantification of S1PR2 signal in GAD67+ cells (shS1PR2, n = 47; shCtrl, n = 55; *P < 0.05; unpaired t test). Typical analyzed infected and noninfected neurons are indicated by yellow and white arrowheads, respectively. Scale bar, 10 μm. (C) Heatmap showing firing rate (FR) of individual inhibitory (IN) units in HC and EE conditions after shS1PR2 (n = 70) or ShCtrl (n = 123) injection. Units were sorted by their average 30-min FR in the HC condition. (Lower) Average FR of all units in each condition. Dashed gray line is the average value in the HC condition. (D) Average FR of IN units in HC and EE conditions (*P < 0.05; one-way ANOVA). (E) Distribution of increase, no change, and decrease in FR of INs. (F) Heatmap showing FR of individual DGC units in HC and EE conditions after shS1PR2 (n = 95) or shCtrl (n = 104) injection. (G) Average FR of DGC units in HC and EE condition (n.s., P > 0.05; one-way ANOVA). (H) Distribution of increase, no change, and decrease in FR of DGCs.

