Fig. 3.
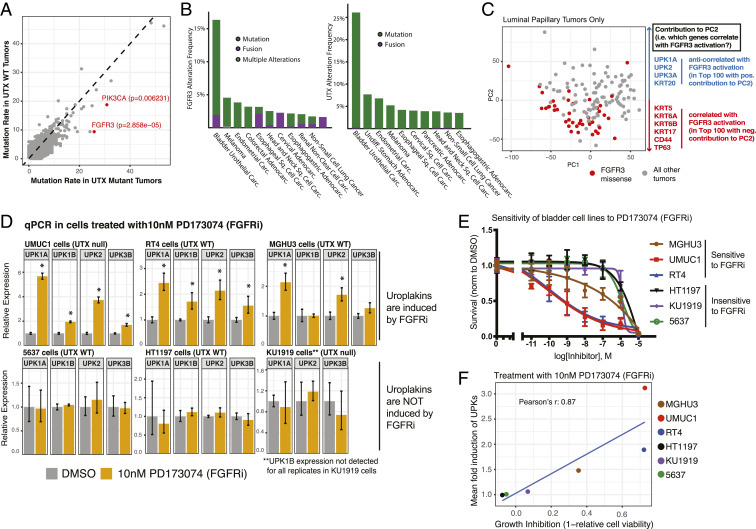
Loss-of-function UTX mutations cooccur with activating mutations of upstream kinases that regulate differentiation pathways. (A) Plot of mutation rate of proteins in either UTX mutant or UTX wild-type tumors present in TCGA muscle invasive bladder cancer data. Genes of interest, FGFR3 and PIK3CA, are highlighted in red. P values were obtained from the cBioPortal, and were calculated using a Fisher’s exact test. (B) Genetic alteration frequencies of FGFR3 (Left) and UTX (Right) in numerous TCGA studies are shown. Abbreviations: adenocarc. adenocarcinoma; carc., carcinoma; sq., squamous. (C) PCA of bladder cancer tumors in the luminal-papillary mRNA subtype of TCGA cohort based on RNA-seq gene-expression data. Tumors with an FGFR3 missense mutation are highlighted in red. The top 100 genes that are correlated and anticorrelated with PC2 were identified, and key differentiation genes on either end of PC2 in terms of correlation are shown at right. (D) qPCR analysis of a panel of bladder cancer cell lines treated with either DMSO or 10 nM of the FGFR inhibitor (FGFRi) PD173074 for 48 h. Treatments began 24 h after the cells were plated. Mean expression was calculated from a representative experiment of three replicates and is relative to the DMSO-treated cells, and *P < 0.05 by t test compared to DMSO-treated cells. (E) Cell viability of a panel of bladder cancer cell lines after treatment with increasing doses of PD173074. Cells were plated, treated the following day, and cell density was quantified after 96 h by CellTiter-Glo. These measurements were then normalized to the DMSO condition. At least two replicate experiments (each with three technical replicates) were performed for each cell line at the indicated doses. (F) Growth inhibition by PD173074 after 96 h of treatment is plotted against the mean induction of gene expression of UPK1A, UPK1B, UPK2, and UPK3B for the panel of bladder cancer cell lines. Note that UPK3A was not expressed in majority of cell lines so was excluded and UPK1B was excluded for the KU1919 calculation due to being on the edge of detection.

