Fig. 4.
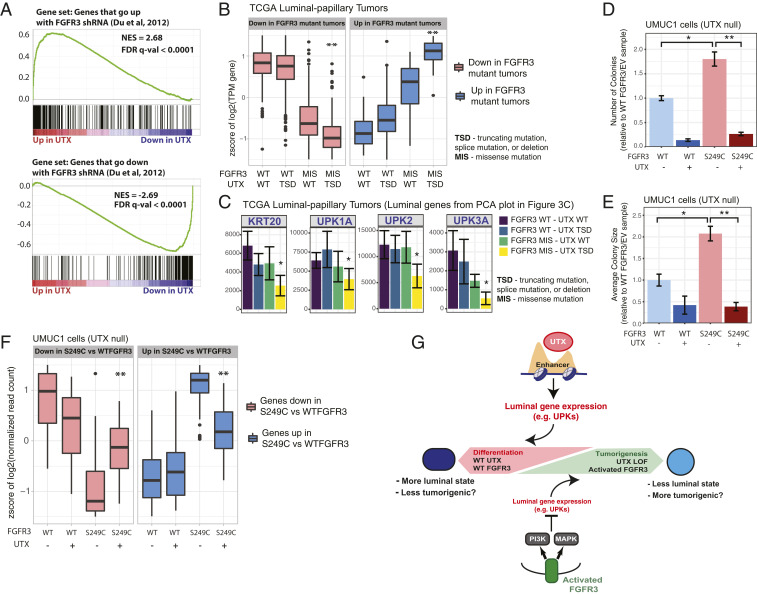
UTX counteracts FGFR3 activation. (A) Gene set enrichment analysis showing how the top 200 genes that go up (Upper) or down (Lower) after shRNA knockdown of FGFR3 in RT112 bladder cells [from a published dataset (40)] are altered by wild-type UTX expression in the UMUC1 cells in full media when compared to EV cells. (B) Plot showing the distribution of z-scores for gene expression as measured by RNA-seq across FGFR3 and UTX genotypes for genes that go down (Left) or up (Right) in luminal-papillary (TCGA mRNA subtype) tumors with an FGFR3 missense mutation (MIS) compared to tumors with wild-type FGFR3 (log2 fold-change > 2 and P < 0.0005). “TSD” for UTX genotype indicates either a truncating, splice, or deletion mutation. Only tumors with wild-type MLL3 and MLL4 (KMT2C and KMT2D) were included in this analysis. **P < 0.05 by Wilcoxon rank sum test compared to the FGFR3 missense/UTX wild-type tumors for that group of genes. (C) Normalized RNA-seq read signal of select differentiation genes across the FGFR3 and UTX genotypes described in B within luminal-papillary (TCGA mRNA subtype) tumors. *P < 0.05 as calculated by differential gene-expression analysis performed with DESeq2. (D and E) Quantification of the number (D) and size (E) of colonies formed in agar by UMUC1 cells expressing FGFR3 and/or UTX. Data from at least 10 wells from two separate experiments are shown, and *P < 0.05 by t test for S249C FGFR3/EV cells compared to WT FGFR3/EV cells, while **P < 0.05 by t test for S249C FGFR3/EV cells compared to S249C FGFR3/UTX cells. (F) Plot showing the distribution of z-scores for gene expression as measured by RNA-seq from UMUC1 cells expressing FGFR3 and/or UTX for genes that go down (Left) or up (Right) in S249C FGFR3 versus wild-type FGFR3-expressing cells (log2 fold-change > 1.5 and P < 0.05). Cells were harvested 24 h after being plated. **P < 0.05 by Wilcoxon rank sum test compared to the FGFR3 S249C/UTX null cells for that group of genes. (G) Model for the antagonizing roles of UTX and FGFR3 in the regulation of differentiation genes and tumorigenesis.

