Fig. 3.
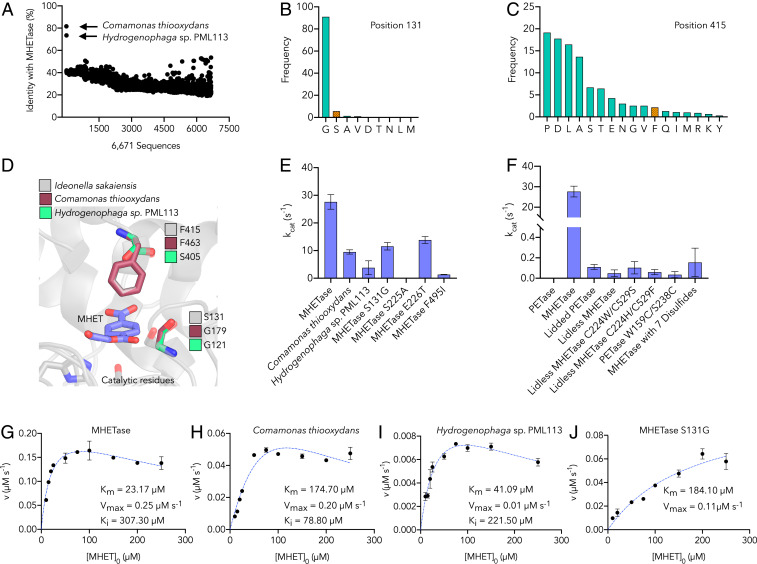
Characterization of MHETase, homologs, and mutants. (A) Sequence identity of 6,671 tannase family sequences retrieved by PSI-BLAST compared to MHETase. Sequences (x axis) are in the same order returned by PSI-BLAST. (B and C) Conservation analysis of residue positions 131 (B) and 415 (C) (using MHETase numbering). Frequency of each amino acid is based on a multiple sequence alignment of the 6,671 tannase family sequences. The residue found in MHETase at each position is indicated in orange. (D) Homology model of the MHET-bound active site within 6 Å of the bound substrate comparing MHETase to homology models of the C. thiooxydans and Hydrogenophaga sp. PML113 homologs (generated by SWISS-MODEL) (54), showing sequence variation at residue positions corresponding to Ser131 and Phe415 in MHETase. (E and F) The rate of enzymatic turnover of MHET determined for MHETase, both homologous enzymes, and the indicated MHETase mutants, all of which are active on MHET save the catalytic mutant (S225A) (E), and enzymatic turnover rates for PETase, MHETase, and selected mutants on MHET (F), using 5 nM purified enzyme and 250 µM substrate at 30 °C. (G–J) The initial enzyme reaction velocity as a function of substrate concentration for MHETase, C. thiooxydans, Hydrogenophaga sp. PML113, and the MHETase S131G mutant, respectively. Dashed blue lines represent the Michaelis–Menten kinetic model fit with substrate inhibition (G–I) or fit with the simple Michaelis–Menten model (J). Key kinetic parameters are provided in the Inset. Additional parameters and confidence intervals on the listed parameters are provided in SI Appendix, Table S3.

