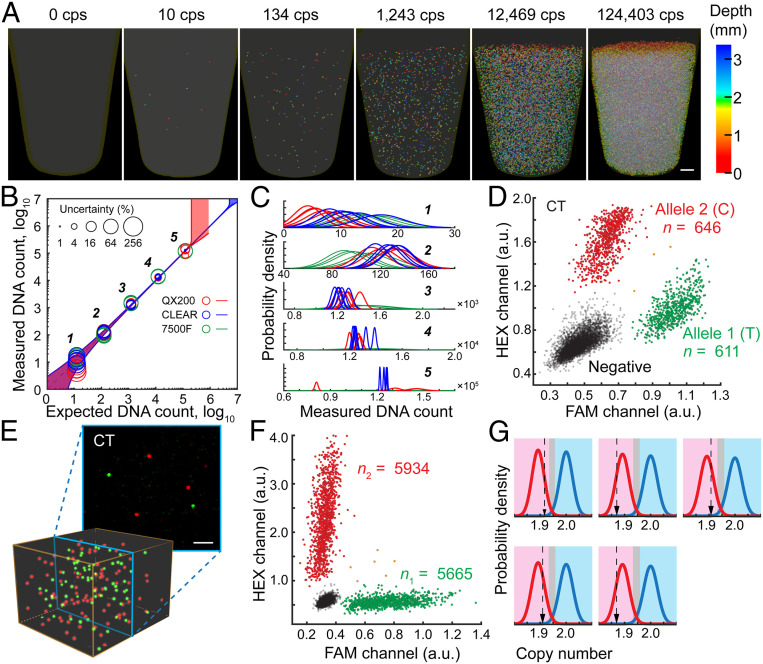
Fig. 4.
Performance of CLEAR-dPCR with different assays. (A) Absolute in situ quantification of positive droplets in a PCR tube, with 105 dynamic range. (Scale bar: 500 µm.) (B) Comparison of quantification performance by CLEAR-dPCR, QX200-ddPCR, and 7500F-qPCR, with their uncertainty levels (95% confidence) shown as the circle sizes. The shaded areas along the diagonal represent the 95% confidence boundaries. (C) Probability density distribution of each measurement. (D) SNP detection and allele counting. Scatterplot results of a heterozygous sample at SNP rs10092491. (E) The heterozygote’s merged images (Top) and 3D reconstructions (Bottom) of both channels. (Scale bar: 200 µm.) (F) Clinical copy number variation detection. Copy numbers of Chr 1 uc13 (red) and the TSC2 gene (green) were detected in a mock sample with 5% deletion of TSC2 exons. (G) Results of five TSC tests of mock-affected samples using a likelihood ratio classifier. Relative copy number in the magenta region is classified as affected, in light blue as healthy, and in gray undetermined.

