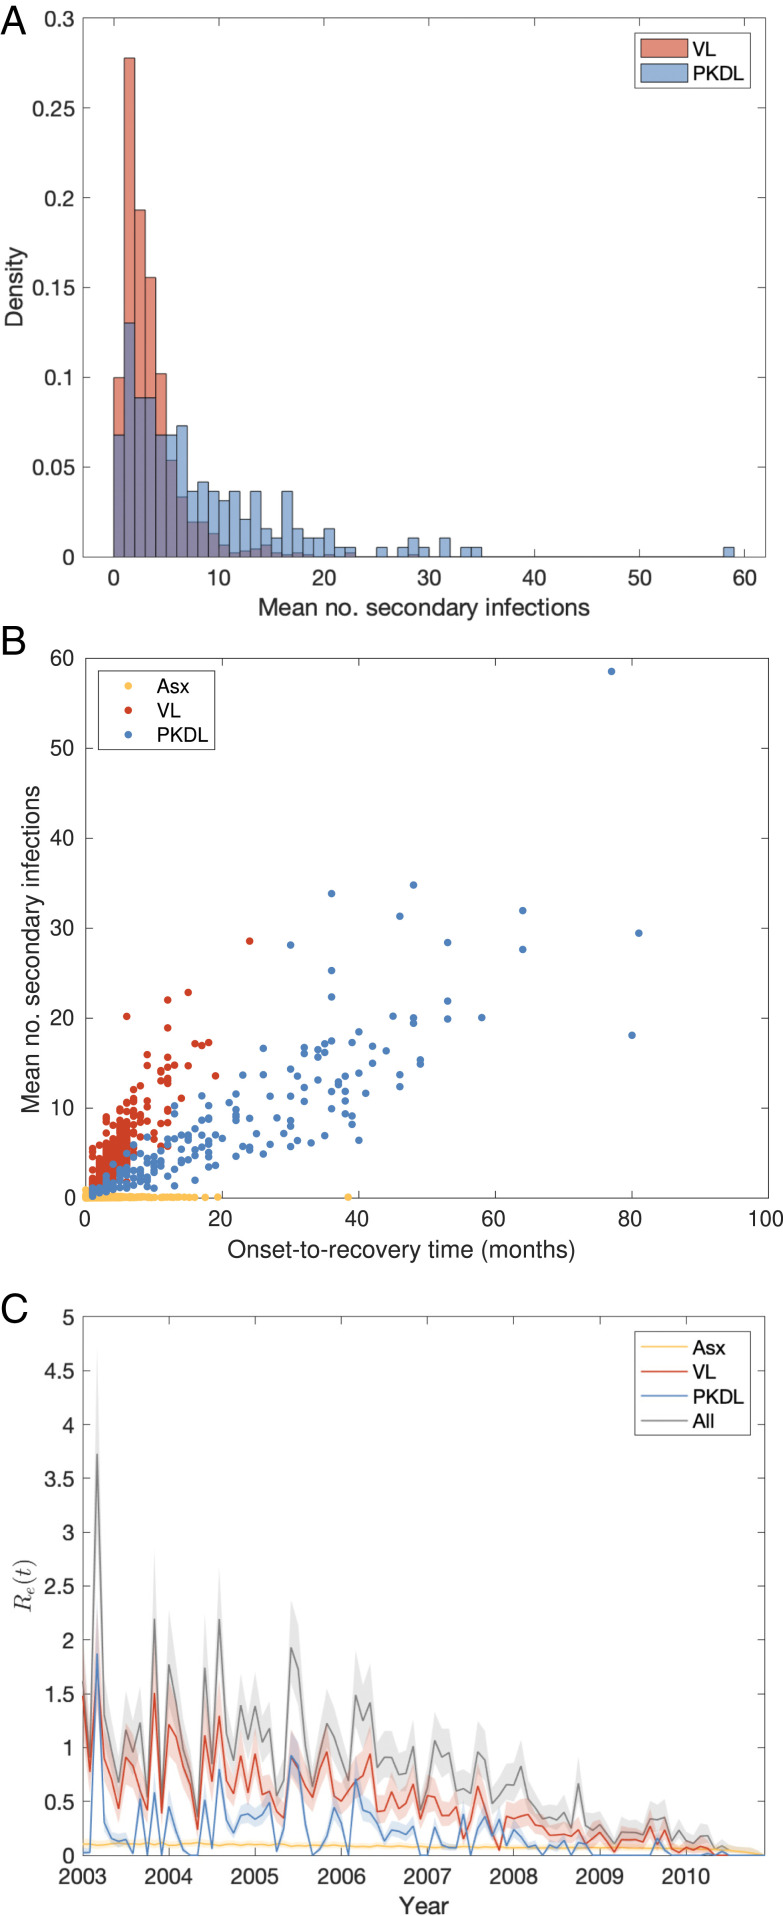
Fig. 5.
(A) Distributions of mean numbers of secondary infections per VL and PKDL case. (B) Relationship between mean number of secondary infections and onset-to-recovery time for VL and PKDL cases and infection-to-recovery time for asymptomatic individuals. (C) Effective reproduction number with contributions from asymptomatic individuals, VL and PKDL cases. Solid lines show medians and shaded bands 95% CIs.

