Fig. 1.
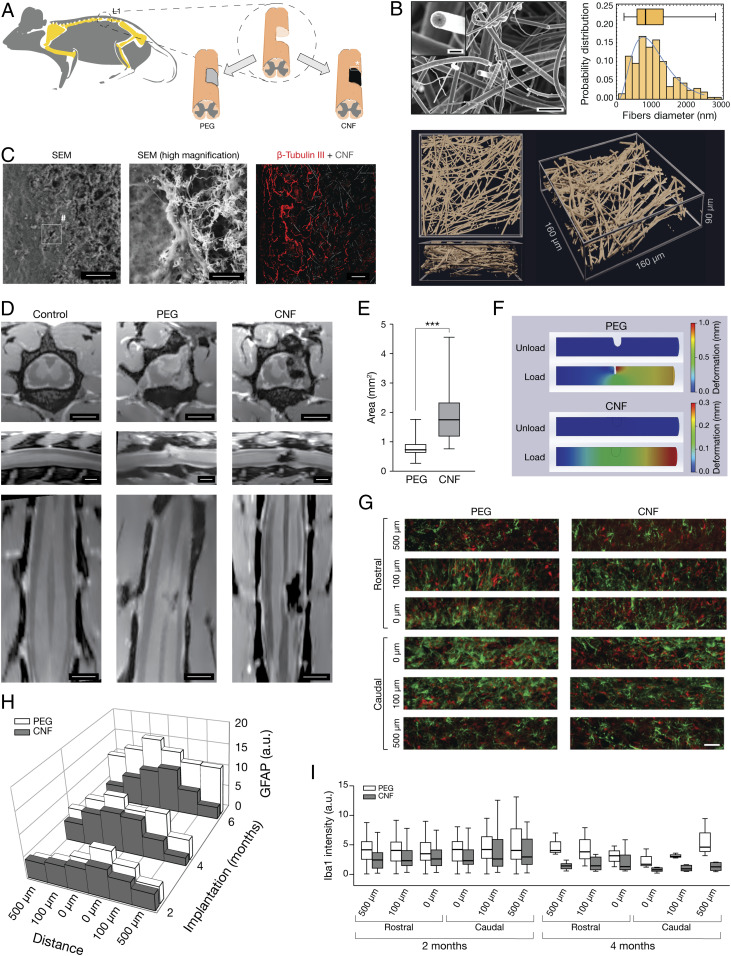
CNF implanted in rat SCI. (A) Experimental setting. (B) High-magnification SEM micrographs (Top) and 3D confocal reconstruction (bottom; reflection mode, top and side projections) of CNF before implantation. Bar plot: probability distribution of MWCNTs diameter. SEM scales: 4 μm and 500 nm in the Inset. (C) Low (Left) and high (Middle) magnification SEM micrographs of CNF-implanted SCI spinal cord; scales, 40 µm and 1 µm, respectively. Confocal micrograph (Right) visualizing CNF by reflection mode and β-tubulin III-positive axons, same animal as above; scale, 50 µm. (D) MRI images (Top to Bottom; transverse, sagittal, and longitudinal sections); note the dark appearance of the CNF due to the porous nature of the implant; scales, 2 mm. (E) Box plot of the lesion dimension (***P = 0.0006). (F) FEM simulation of the viscoelastic deformation of a cylinder mimicking a spinal cord with the hemisected lesion left empty upon PEG dissolution (Top) or filled with an implant characterized by mechanical properties matching those of CNF (Bottom). (G) Immunofluorescence images taken at 0, 100, and 500 µm, rostral and caudal to the lesion edge, GFAP+ (green), and Iba-1+ (in red) neuroglia. Scale, 50 µm. (H) 3D plot and (I) box plots summarize GFAP and Iba-1 intensity average values.

