Fig. 2.
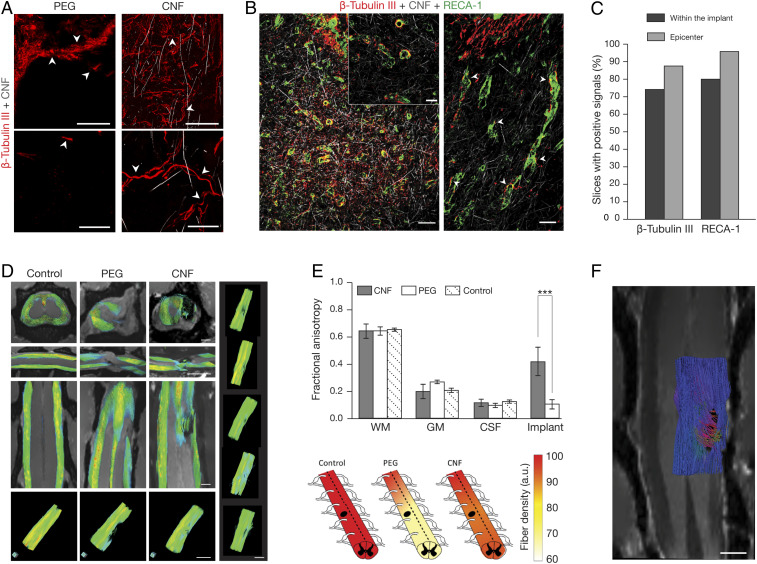
CNF supports axonal regeneration. (A) Confocal micrographs detail the lesion site at low (Top) and high (Bottom) magnification. Arrowheads indicate shredded remains and fibers in PEG (Left) and tortuous axons within the CNF (Right). Scales top (Left and Right), 100 µm; bottom (Left and Right), 25 µm. (B) Low (Left) and high (Inset and Right) magnification of CNF-implanted spinal cord at the lesion site. Arrowheads indicate coexistence of β-tubulin III-positive fibers and RECA1-+ blood vessels. Scale, left 100 µm, right and Inset 40 µm. (C) Quantification of fields with neurites or blood vessels traversing across and at the epicenter of the CNF. (D) Fiber tracks in aged-matched naïve (Control), and SCI (PEG and CNF) at 5 to 6 mo after surgery, FA values ranging from FA = 0 (in blue) to FA = 1 (in red). Right column: 3D representations of fiber tracts of five different examples of 5 to 6 mo CNT-implanted animals. Scales, 2 mm. (E, Top) FA, mean ± SD. Bottom heat plots of fiber density quantified from fiber tracking (***P = 1.9 e−05). (F) Fiber tracking analysis of DTI data constructed along the implant area of a CNF-treated rat (6 mo post-SCI; only half spine presented, to facilitate visualization), with the enclosed two-dimensional (2D) MRI coronal plane through the implant. Colors represent fiber orientation following conventional code for tensor directionality (blue: anterior-posterior, red: left-right and green: dorsal-ventral directions). Scale, 1 mm.

