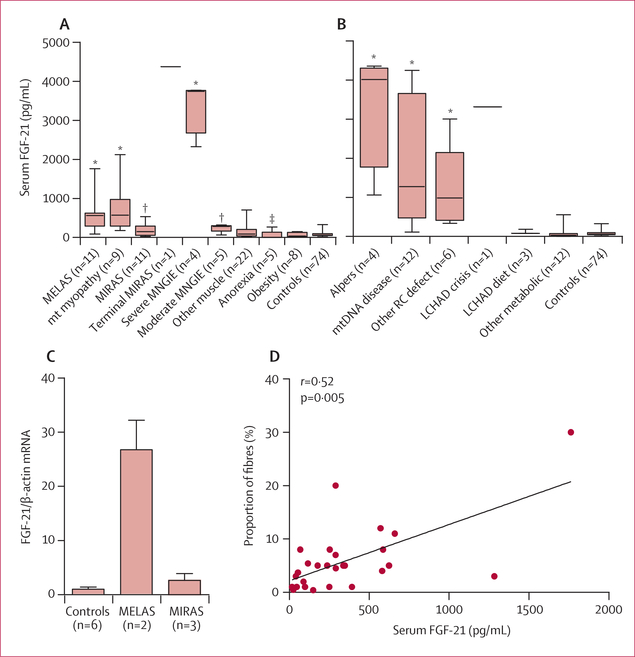
Figure 1: FGF-21 concentrations in serum in patients with mitochondrial disorders and healthy controls.
Data for patients with mitochondrial disorders are separated shown by specific disease groups. (A) Adult patients. (B) Paediatric patients. (C) FGF-21 messenger RNA expression in the skeletal muscle of six controls, two patients with MELAS, and three patients with MIRAS measured by quantitative PCR relative to β-actin. (D) Correlation between FGF-21 concentrations in serum and proportion of COX-negative fibres (n=28). Mann-Whitney U test was used to compare FGF-21 concentrations between subgroups of patients and between patients and controls, and data in A, B, and C are mean (SD) and range, and p values are for comparisons with controls. MELAS=mitochondrial encephalomyopathy, lactic acidosis, and stroke-like episodes. mt=mitochondrial. MIRAS=mitochondrial recessive ataxia syndrome. MNGIE=mitochondrial neurogastrointestinal encephalomyopathy. Alpers=Alpers’ encephalopathy. RC=respiratory chain. LCHAD=long-chain 3 hydroxyacyl CoA dehydrogenase deficiency. COX= cytochrome-c oxidase. *p<0·001. †p<0·01. ‡p<0·05.

