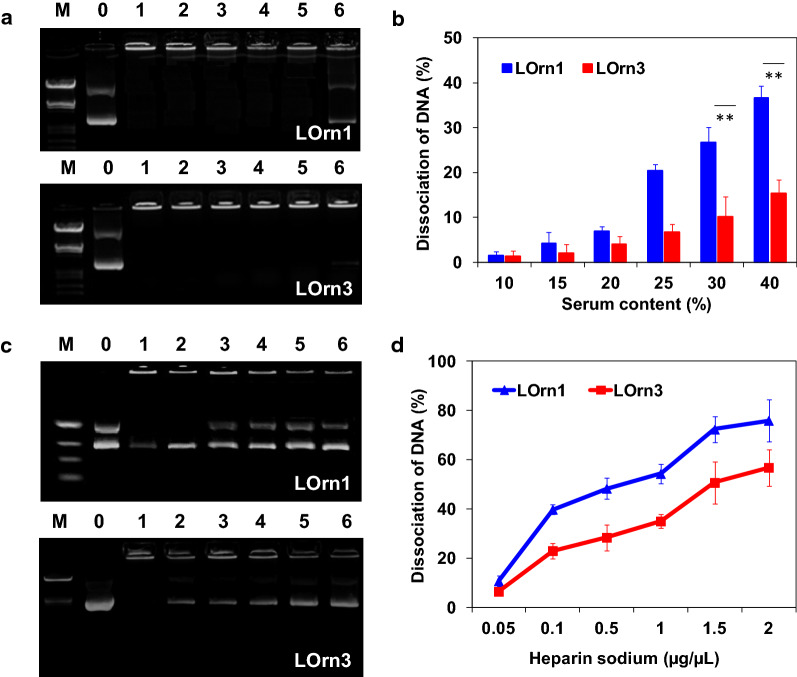
Fig. 6.
Effect of serum and heparin sodium on the stability of LOrn1/DNA lipoplexes with a charge ratio of 4:1 and LOrn3/DNA lipoplexes with an charge ratio of 3:1. a Agarose gel electrophoresis of the lipoplexes at different serum contents (Lane M: marker; Lane DNA: free DNA; Lanes 1–6: serum contents of 10%, 15%, 20%, 25%, 30%, and 40%, respectively). b Quantitative analysis of the dissociation rate of lipoplexes in the present of serum. c Agarose gel electrophoresis of the lipoplexes at different concentrations of heparin sodium (Lane M: marker; Lane DNA: free DNA; Lanes 1–6: heparin sodium concentrations of 0.05, 0.1, 0.5, 1.0, 1.5, and 2.0 µg/µL, respectively). d Quantitative analysis of the dissociation rate of lipoplexes in the present of heparin sodium. Each bar represents the mean ± SD (n = 5). Significance levels: **p < 0.01

