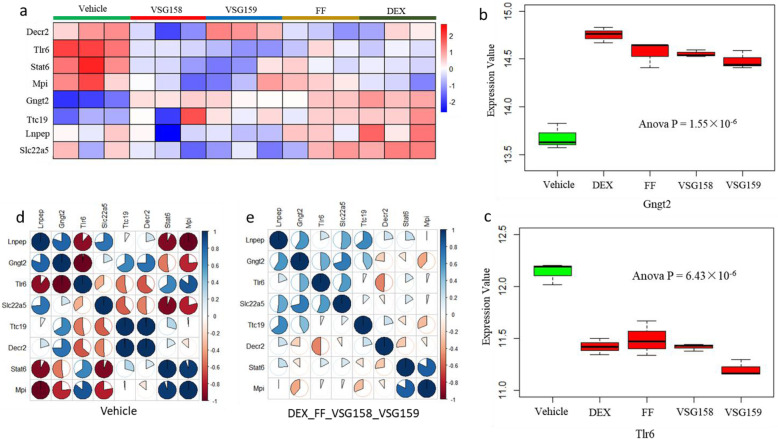
Fig. 7.
Altered gene expression profiles treated with various glucocorticoids for severe asthma. a The heatmap shows the differential expression profiles between vehicle and various glucocorticoids including VSG158, VSG159, FF, and DEX. b Boxplot shows the significant difference of Gngt2 expression between vehicle and various glucocorticoids including VSG158, VSG159, FF, and DEX. c Boxplot shows the significant difference of Tlr6 expression between vehicle and various glucocorticoids including VSG158, VSG159, FF, and DEX. d Co-expression patterns of identified genes in vehicle group. e Co-expression patterns of highlighted genes in glucocorticoid group (including VSG158, VSG159, FF, and DEX)

