Fig. 3.
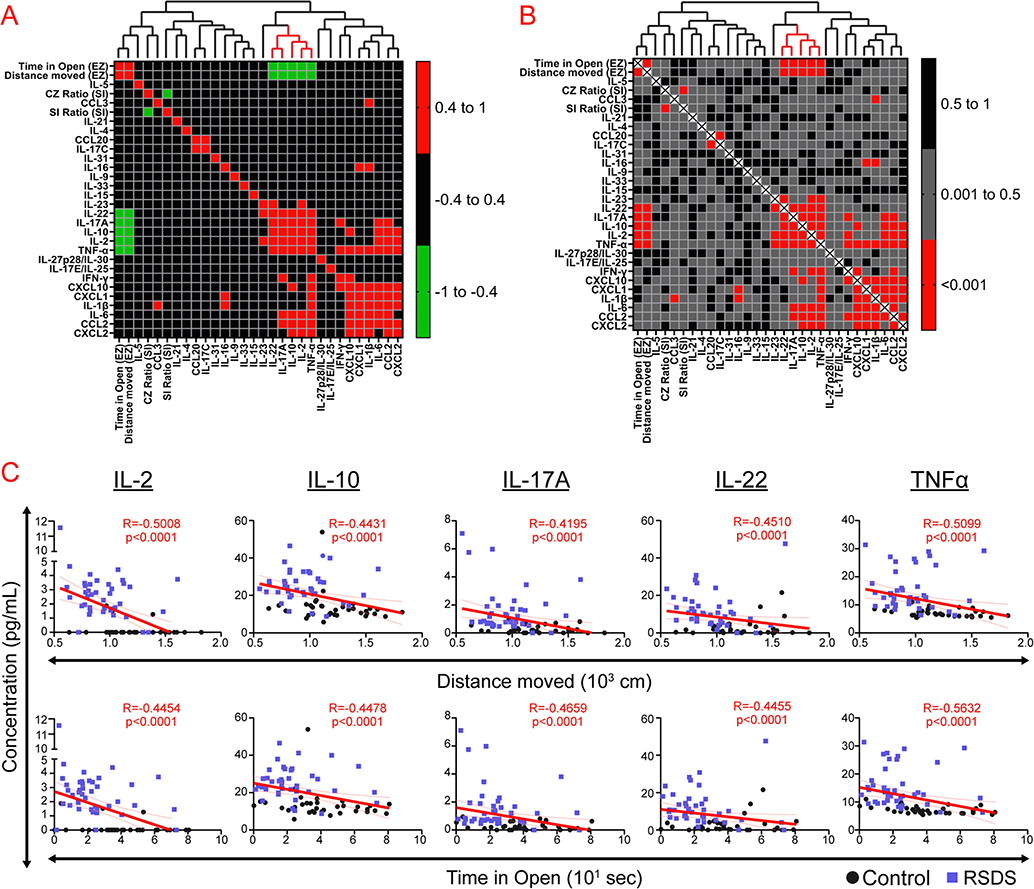
Selected cytokines and EZM parameters demonstrate significant associations and hierarchical clustering. Mice were run through the 10-day RSDS paradigm followed by behavioral testing, plasma extraction, and inflammatory assessment by Meso Scale Discovery multiplex analysis. Correlation matrices and cluster analyses were completed for all behavioral and detectable circulating inflammatory proteins within each animal. A Heat map representation of correlation matrix of all variables with hierarchical clustering above. Colors represent Spearman R coefficients (two-tailed test) with accompanying legend. B. Heat map representation of correlation matrix of all variables with hierarchical clustering above. Colors represent p-values by Spearman correlation (two-tailed test) with accompanying legend. C. Individual correlation plots of select significant cytokines and elevated zero maze parameters. N = 35 control, 40 RSDS used for all analyses. Significance by Spearman correlation (two-tailed test).

