Fig. 5.

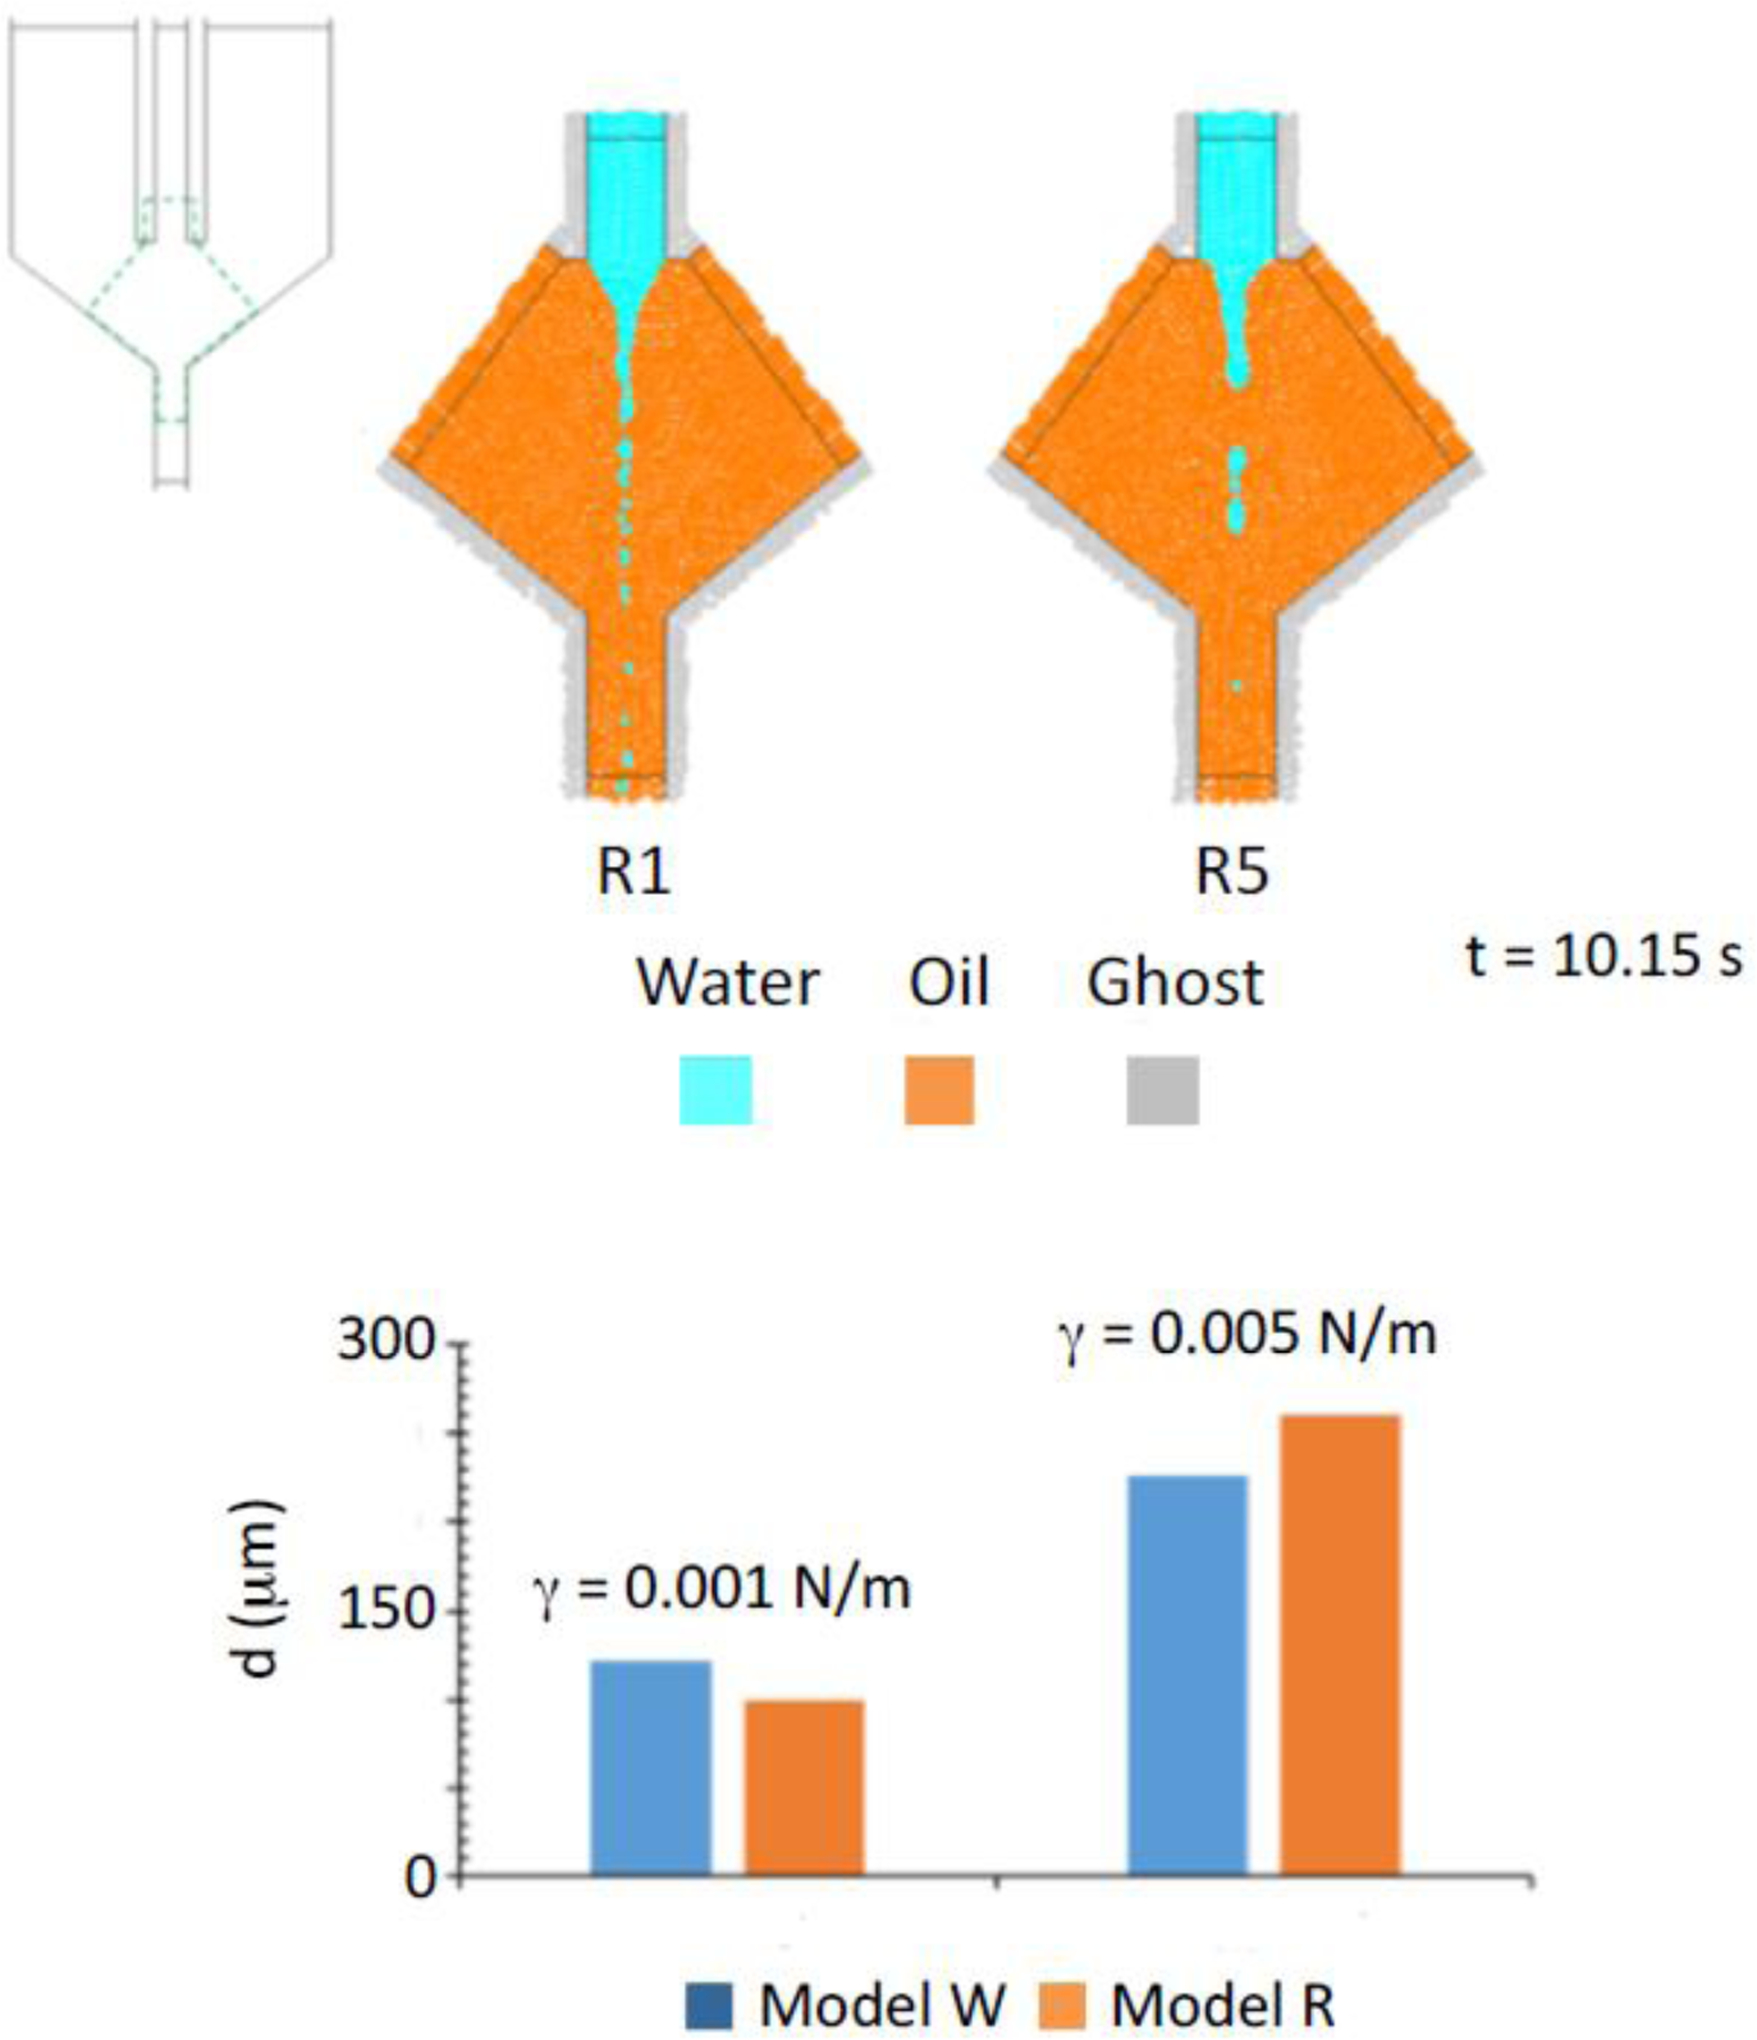
Water and oil particles distribution in the biphasic simulations of Model R at t=10.15 s and γ = 0.001 N/m (R1) or γ = 0.005 N/m (R5). Panel below: comparison between Model W and Model R for droplet size as a function of surface tension.

Water and oil particles distribution in the biphasic simulations of Model R at t=10.15 s and γ = 0.001 N/m (R1) or γ = 0.005 N/m (R5). Panel below: comparison between Model W and Model R for droplet size as a function of surface tension.