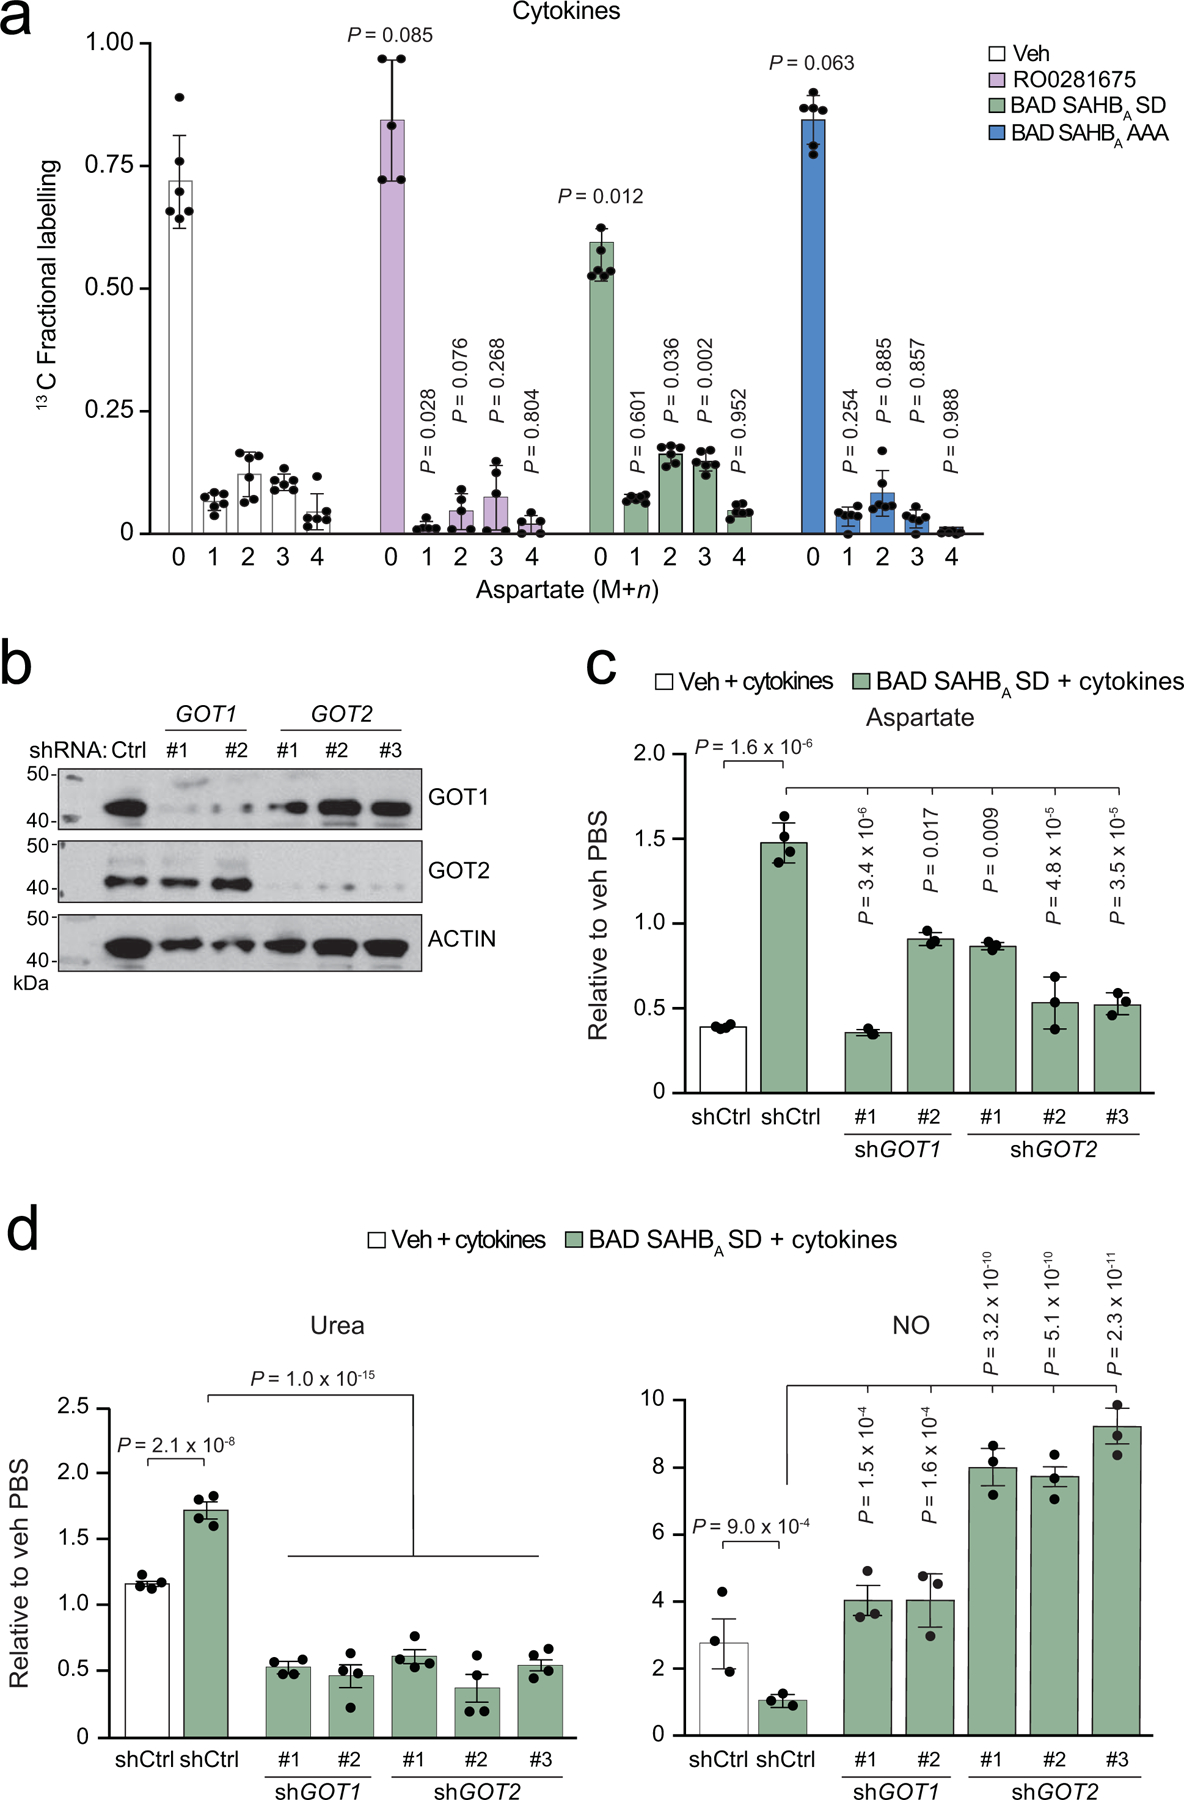
Extended Data Fig. 5. Increased generation of aspartate from glucose following protective GK activation.

a, 13C fractional labelling of aspartate from13C6 glucose. Data are shown as non-normalized to vehicle PBS and display the fraction of each M+n mass isotopomer out of the total pool of aspartate for each condition. For clarity, statistical comparisons are only shown for each M+n of a given condition (RO0281675, BAD SAHBA SD and BAD SAHBA AAA) compared to the corresponding M+n of vehicle control. Data are pooled means from n=6 (Veh), n=5 (RO0281675), and n=6 (BAD SAHBA SD, BAD SAHBA AAA) independent mouse islet isolations and experiments.
b, Western blot analysis of GOT1/2 knockdown efficiency using multiple independent hairpins for data shown in Fig. 4d–e and ED Fig. 5c–d. Blots are representative of n=2 independent experiments with similar results.
c–d, Aspartate (c), urea and NO (d) levels in human islets from the same experiments shown in Fig. 4d–e, displaying the complete set of data on all hairpins tested. Aspartate data are from n = 4 human donors for shCtrl samples and n = 3 donors for knockdown samples. Urea and NO data are from n = 4 and n = 3 donors, respectively.
Statistical analyses in (a) are two-way ANOVA showing p-value comparisons for each condition to Veh, and one-way ANOVA in (c–d), both with Tukey adjustment for multiple comparisons.
