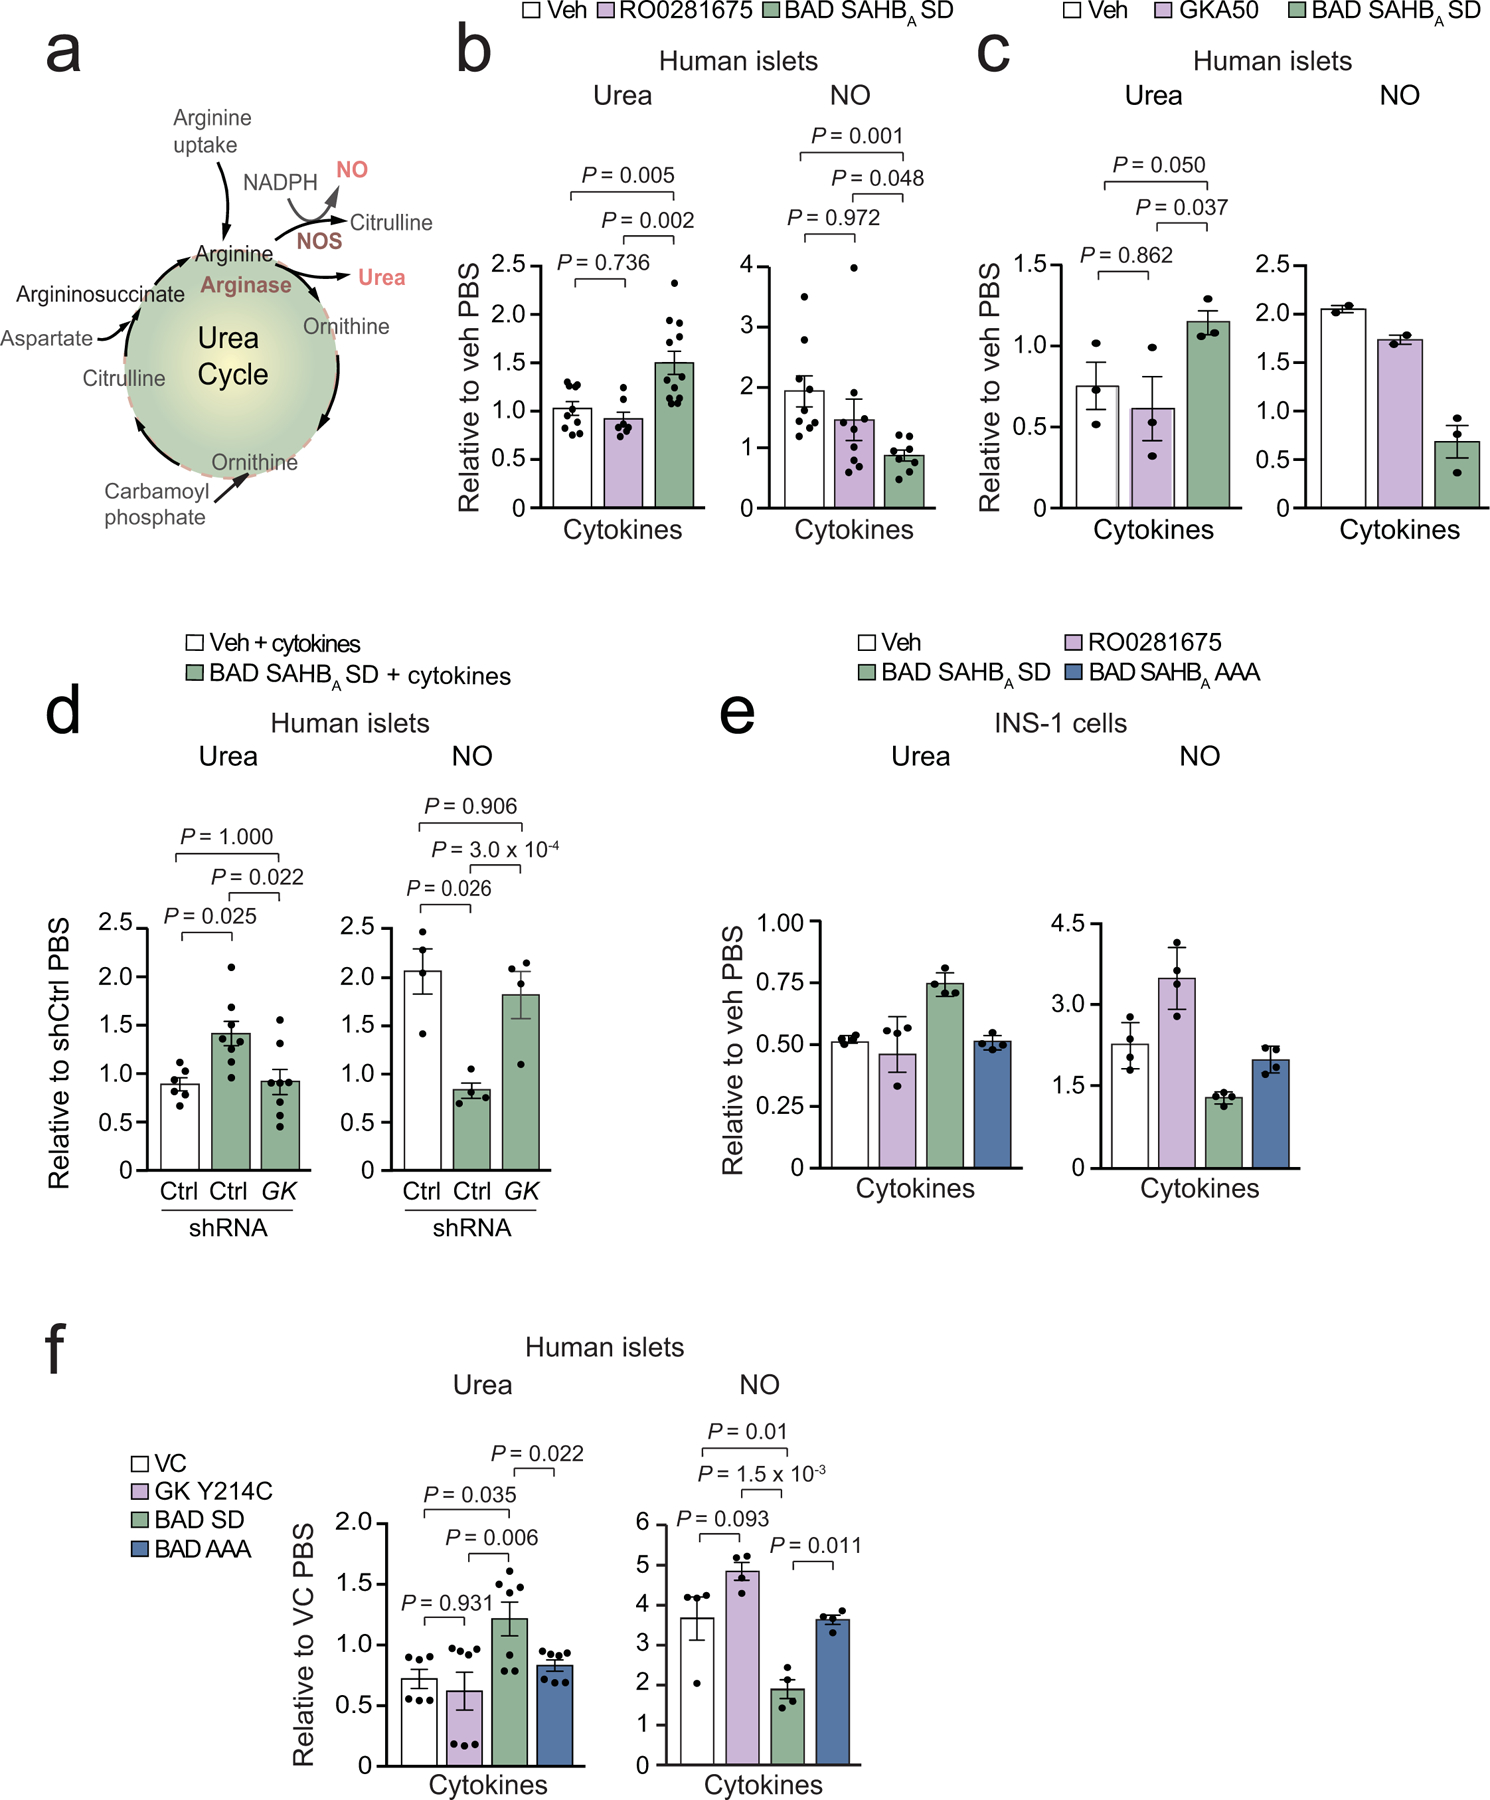
Figure 2. Differential modulation of arginine metabolism by protective vs non-protective GK activation in human islets.

a, Schematic of arginine usage for urea and NO synthesis.
b, Quantification of urea and NO levels in human islets treated with the indicated compounds and exposed to cytokines for 24 h. Values are shown relative to vehicle control PBS samples. Data for urea are from n=10 (Veh), n=7 (RO0281675), and n=12 (BAD SAHBA SD) human donors. Data for NO are from n=9 (Veh and RO0281675) and n=8 (BAD SAHBA SD) human donors.
c, Quantification of urea and NO in human islets treated with the indicated compounds and exposed to inflammatory cytokines as in (b). Data for urea are from n=3 donors. Data for NO are from n=2 (veh and GKA50) and n=3 (BAD SAHBA SD) donors.
d, Data for urea are from n = 4 independent experiments using islet cultures from 2 donors. Data for NO are from n = 4 donors.
e, Urea and NO levels in INS-1 cells treated as in (b) measured at 24 h. Data are means ± s.d. of n=4 technical replicates.
f, Urea and NO levels in human islet expressing the indicated GK and BAD mutants and treated with cytokines as in (b). Data for urea are from 6 (VC) and 7 (GK Y214C, BAD SD and BAD AAA) replicates using islet cultures from 2 donors performed over n=4 independent experiments. Data for NO are from n=4 independent experiments using islet cultures from 2 donors.
Data in b–d and f are means ± s.e.m. with statistical analyses on means from independent experiments using one-way ANOVA with Tukey (b–d) adjustment for multiple comparisons and Fisher’s exact test (f).
