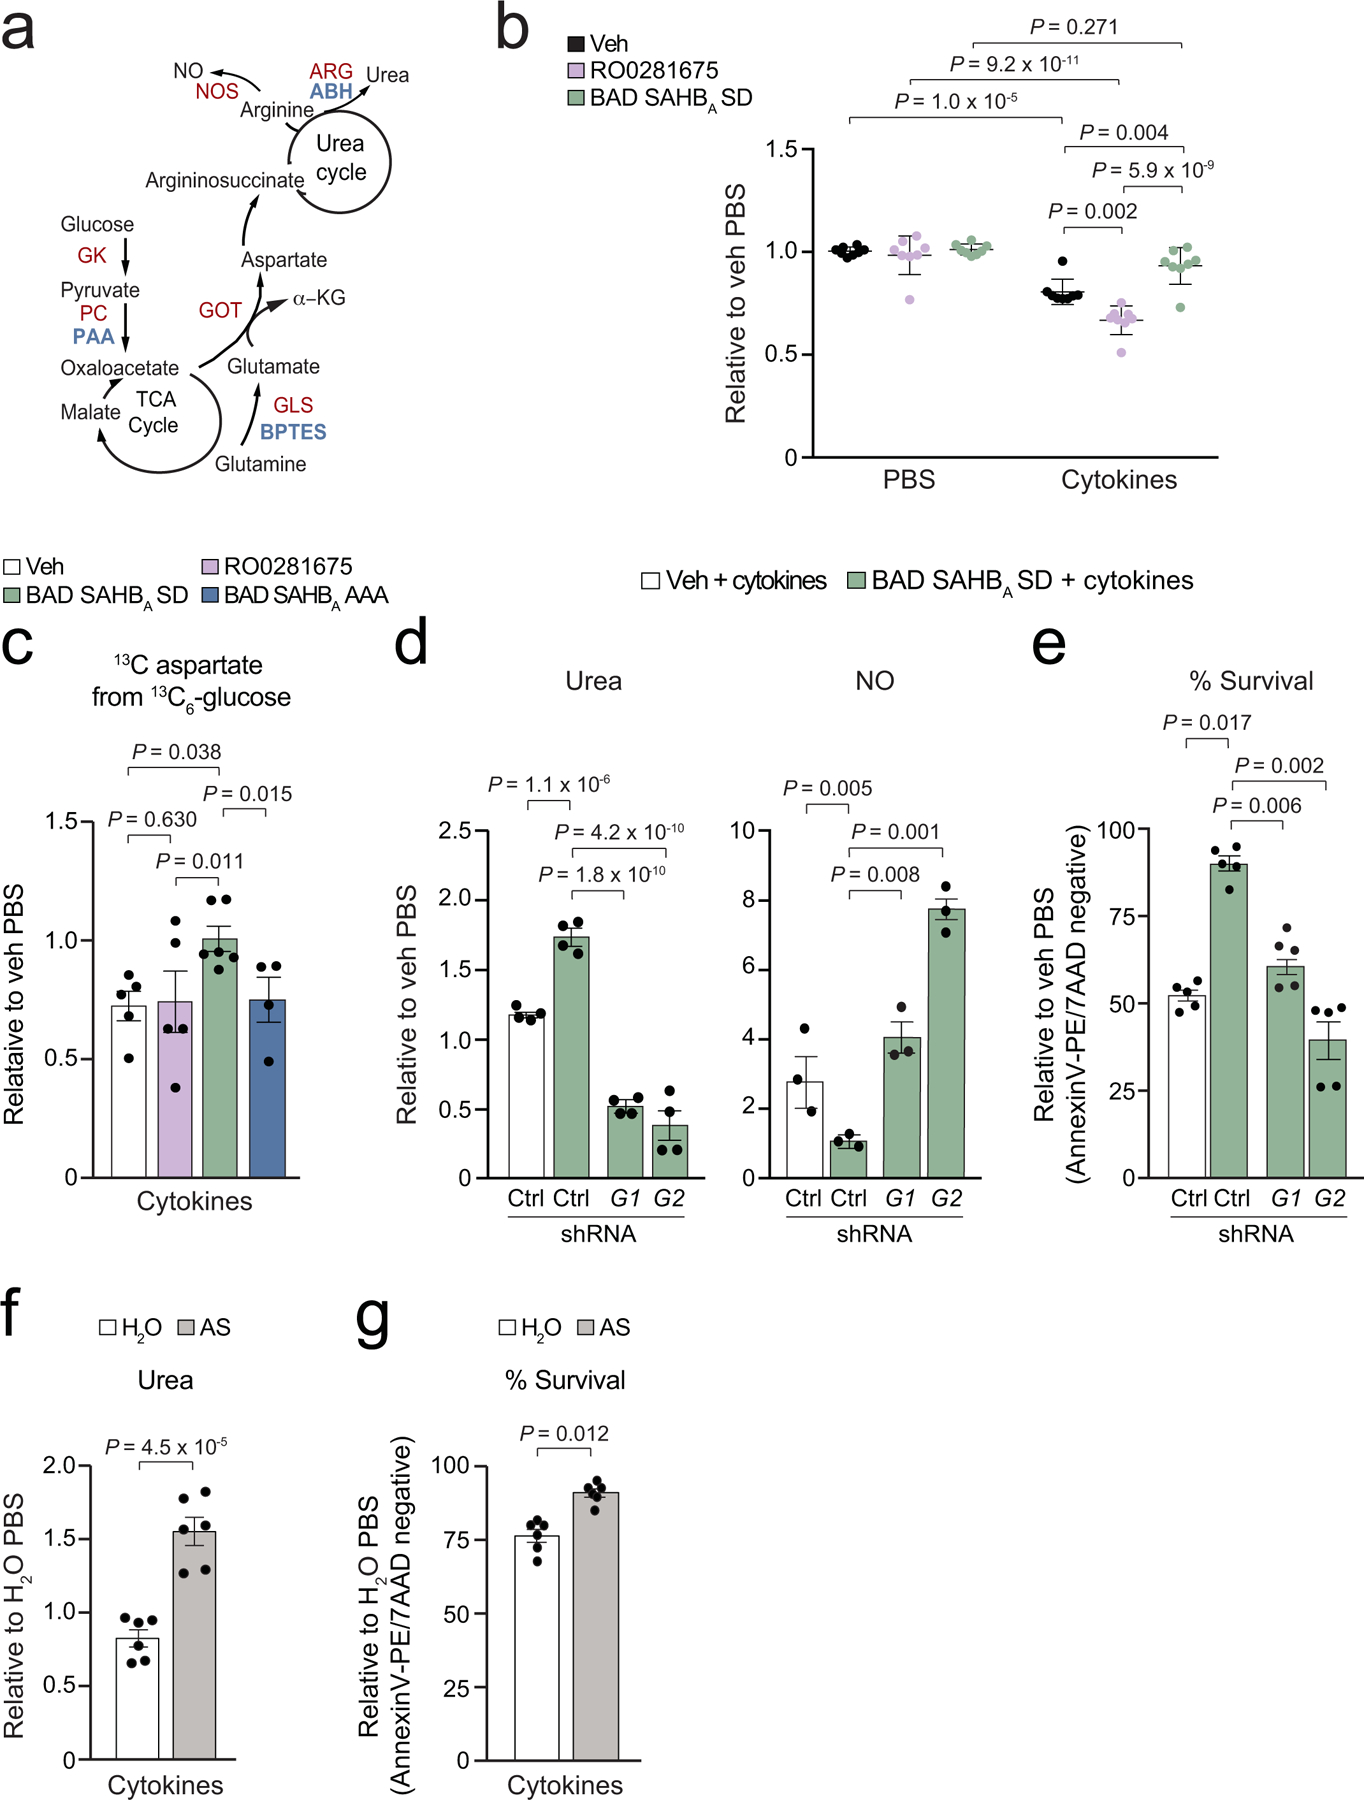
Figure 4 |. Protective glucose metabolism links aspartate to the urea cycle to counter inflammation.

a, Schematic of the TCA and urea cycles and their connection via the aspartate-argininosuccinate shunt. Enzymes of interest are marked in red and their corresponding inhibitors in blue.
b, Total aspartate levels in human islets treated with the indicated compounds and cultured in the absence or presence of inflammatory cytokines. Data are from the untargeted metabolomics analysis in Fig. 1h, n=5 human donors pooled and split into 8 replicates.
c, Contribution of glucose to total aspartate pools in mouse islets labeled with 13C6 glucose and treated with inflammatory cytokines in the context of protective vs non-protective glucose metabolism. Data are from n=5 (Veh, RO0281675), n=6 (BAD SAHBA SD) and n=4 (BAD SAHBA AAA) independent mouse islet isolations and experiments. See Fig. ED 5a for isotopologue distribution of aspartate in an analogous labelling experiment.
d–e, Quantification of urea and NO (d), and viability (e) in human islets subjected to shRNA-mediated GOT1 (G1) or GOT2 (G2) depletion and treated with cytokines in the context of protective vs non-protective glucose metabolism, n=4 donors for urea, n=3 donors for NO, and n=5 donors for viability measurements. Data for one hairpin per gene are displayed (sh#1 for GOT1 and sh#2 for GOT2) from the full data set of multiple hairpins, see ED Fig. 5b–d.
f–g, Quantification of urea levels (f) and viability (g) in human islets supplemented with argininosuccinate (AS) in the presence of inflammatory cytokines, H2O serves as vehicle control for AS. Data are from 6 independent experiments from n=3 donors.
Data are means ± s.e.m. with statistical analyses on means from independent experiments using one-way ANOVA with Tukey adjustment for multiple comparisons.
