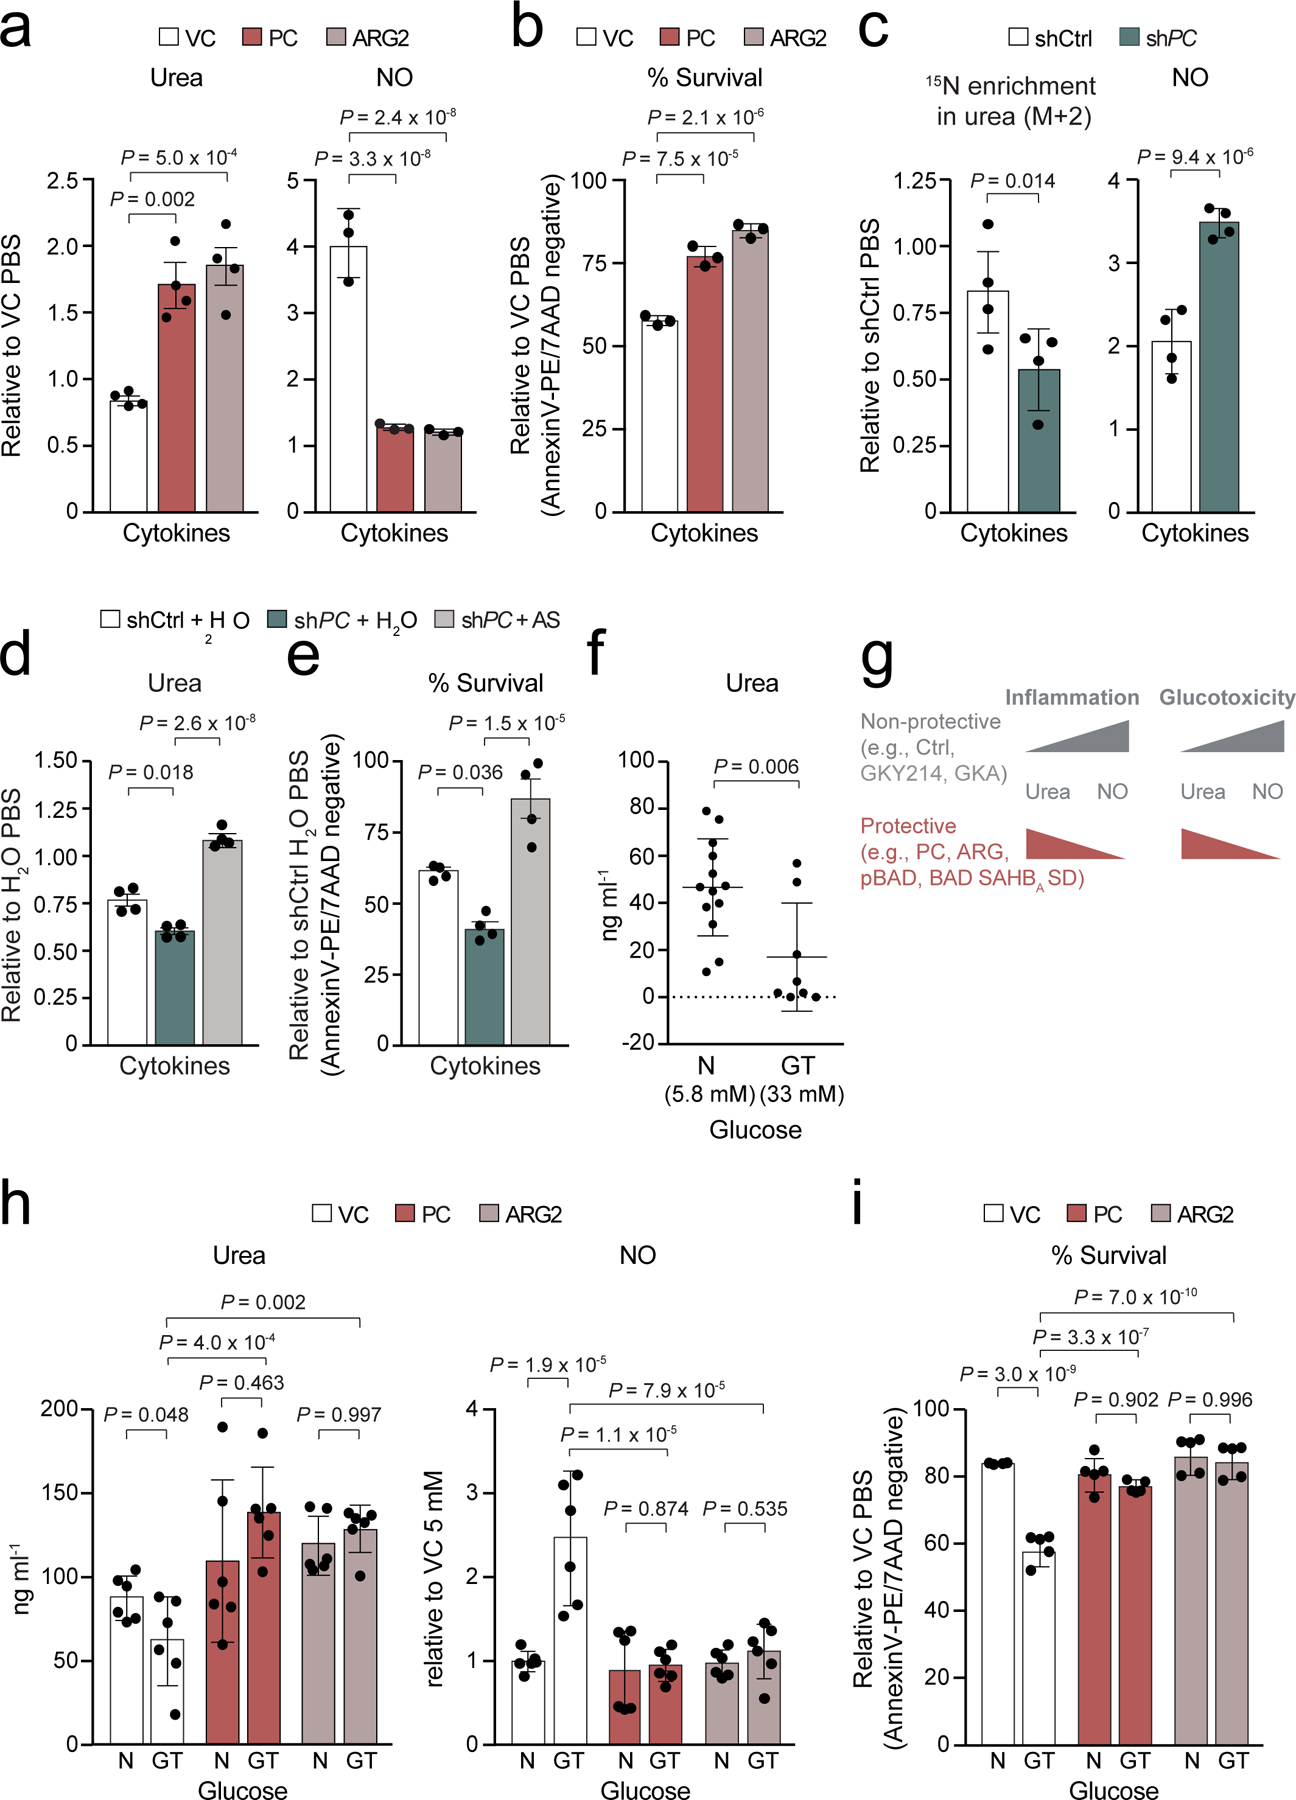
Figure 7 |. Pyruvate carboxylase is sufficient to promote ureagenesis, restrict NO, and protect human islets from inflammation and glucotoxicity.

a–b, Quantification of urea and NO levels (a), and viability (b) in human islets expressing PC or ARG2 in the presence of inflammatory cytokines, n=4 human donors for urea and n=3 donors for NO and viability measurements.
c, Contribution of arginine to urea synthesis and quantification of NO levels in PC-depleted human islets that were labeled with 15N2-arginine and treated with cytokines, n=4 donors.
d–e, Quantification of urea levels (d) and viability (e) in human islets subjected to PC knockdown and exposed to cytokines in the absence (H2O) or presence of argininosuccinate (AS). Data are means ± s.e.m of n=4 independent experiments from 2 donors.
f, Urea concentrations in human islets cultured in normal (N) media with 5.8 mM glucose compared to glucotoxic (GT) conditions as in 72 h culture in 33 mM glucose, n=13 donors for (N) and n=8 donors for (GT), statistical analysis was performed using student’s t-tests.
g, Schematic summary of results showing protective vs non-protective glucose metabolism and PC-directed urea cycle activation as a mechanism that shields cells from stress-induced augmentation in NO and cytotoxicity similar to ARG overexpression or protective GK activation.
h–i, Quantification of urea and NO levels (h) and viability (i) in human islets expressing PC or ARG2 and cultured as in (f); n = 3 donors in duplicates for urea and NO, and n=5 donors for viability assays. N and GT denote normal and glucotoxic conditions, respectively.
Data are means ± s.e.m. from independent experiments with statistical analyses using one-way (a-e) and two-way (h-i) ANOVA with Tukey adjustment for multiple comparisons.
