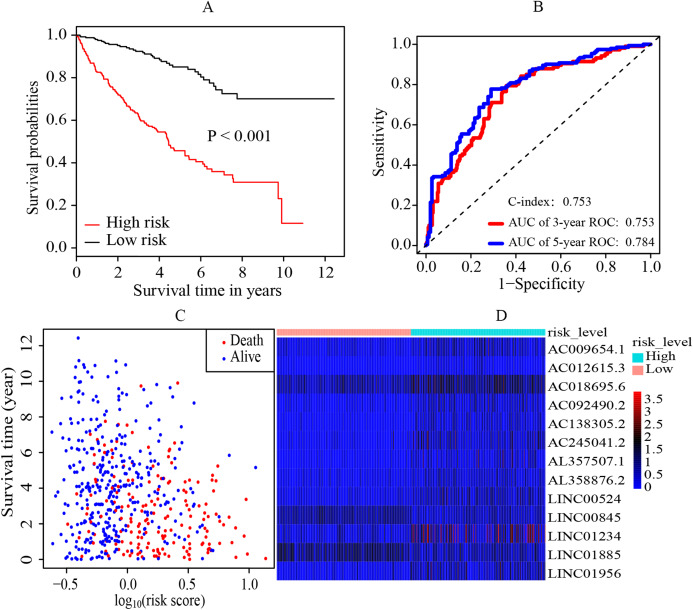
Figure 2. Establishment and evaluation of the prognostic model.
(A) K-M survival curve of the risk level. By multivariate cox regression based on the 13 key prognostic lncRNAs, the prognostic model was established and the patients were divided into high-risk and low-risk group. It revealed that the patients in the high‐risk group had significantly worse OS rate than that of the low‐risk group (p < 0.05). (B) 3-year and 5-year ROC curves and C-index of the 13 key prognostic lncRNAs. AUC = 0.0.753 (3-year ROC) and AUC = 0.784 (5-year ROC), C-index = 0.753. (C) The distribution landscape of the alive and the dead of ccRCC cases in the coordinate system of risk score and survival time. (D) Heatmap of the expression levels of the 13 key prognostic lncRNAs in the high-risk group and low-risk group. The red and blue represent increased and decreased normalized expression value of the lncRNAs in all patients, respectively. K–M, Kaplan–Meier; ROC, receiver operating characteristic; AUC, area under curve; lncRNAs, long non-coding RNAs; OS, overall survival; ccRCC, clear cell renal cell carcinoma.

