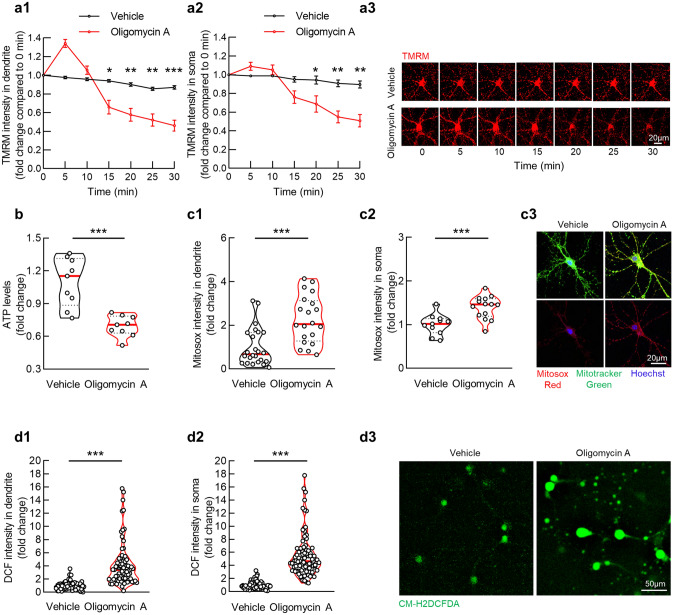
Figure 1.
Oligomycin A treatment compromises mitochondrial function in cultured hippocampal neurons. (a) TMRM intensity indicated cultured hippocampal neuron dendritic (a1) and somatic (a2) mitochondrial membrane potential with vehicle or 1 µM oligomycin A treatment. Unpaired student’s t-test; *P < 0.05, ***P < 0.001. n = 5–10 cells or n = 15–20 dendritic segments per group, respectively. (a3) Representative live images of TMRM, images were recorded at time 0,5,10,15,20,25,30 min. Scale bar 50 µm. (b) Hippocampal neuronal ATP production with vehicle or 1 µM oligomycin A treatment. Unpaired student’s t-test; ***P < 0.001. n = 9 samples each group. (c) Mitosox Red intensity indicated cultured hippocampal neuron dendritic (c1) and soma (c2) Mitochondrial ROS level with vehicle or 1 µM oligomycin A treatment. Unpaired student’s t-test; ***P < 0.001. n = 12–15 cells or n = 20 dendritic segments per group, respectively. (c3) Representative images of Mitosox Red staining. Mitochondria are labeled with Mitotracker green. Hoechst was applied for nucleus staining. Scale bar 20 µm. (d) CM- H2DCFDA intensity indicted cultured hippocampal neuron dendritic (d1) and soma (d2) intra-neuronal ROS level with vehicle or 1 µM oligomycin A treatment. Unpaired student’s t-test; ***P < 0.001. n = 80–100 cells or n = 45 dendritic segments per group, respectively. (d3) Representative images of CM- H2DCFDA (green). Scale bar 50 µm.

