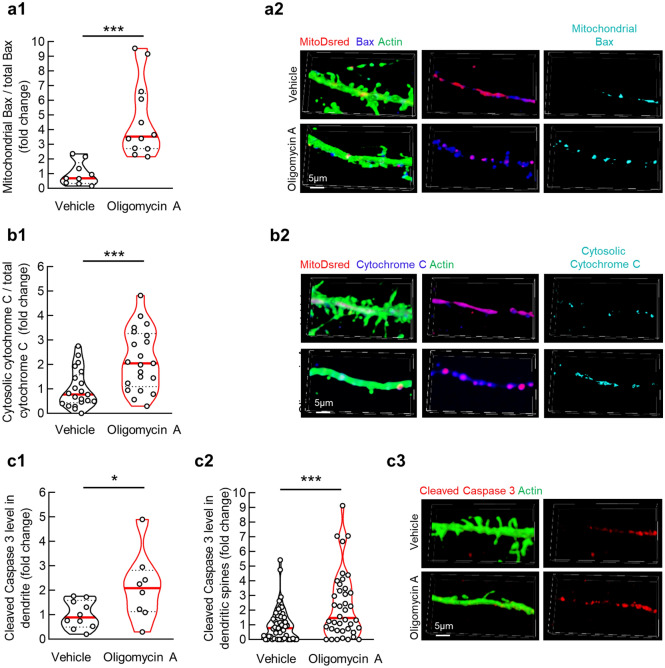
Figure 3.
Oligomycin A treatment activates dendritic local apoptotic signaling in cultured hippocampal neurons. (a1) Dendritic mitochondria translocated Bax levels in cultured hippocampal neurons with vehicle or 1 µM oligomycin A treatment. Unpaired student’s t-test; ***P < 0.001. n = 9–12 dendritic segments. (a2) Representative images of mitochondria (red), Bax (blue) and dendrites (green). Scale bar 5 µm. (b1) Dendritic Cytochrome C release levels in cultured hippocampal neurons with vehicle or 1 µM oligomycin A treatment. Unpaired student’s t-test; ***P < 0.001. n = 21 dendritic segments. (b2) Representative images of mitochondria(red), Cytochrome C (blue) and dendrites (green). Scale bar 5 µm. (c1) Cleaved Caspase levels in cultured hippocampal neuron dendrite (c1) or dendritic spine (c2) with vehicle or 1 µM oligomycin A treatment. Unpaired student’s t-test; *P < 0.05. n = 10 dendritic segments. (c3) Representative images of Cleaved Caspase 3 (red) and dendrites (green). Scale bar 5 µm.

