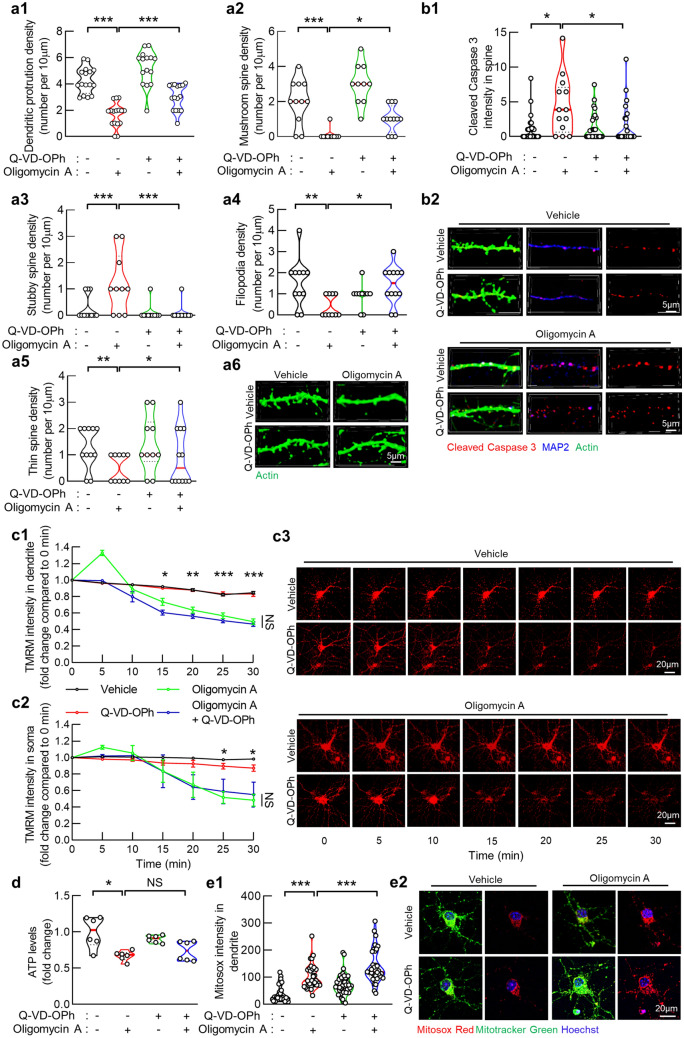
Figure 4.
Caspase 3 inhibition protects spine density and architecture in oligomycin A treated neurons. (a) Attenuated oligomycin A-induced dendritic protrusion reduction in 1 µM Q-VD-OPh treated hippocampal neurons. (a1) Dendritic protrusion of vehicle, 1 µM Q-VD-OPh and/or 1 µM oligomycin A treated hippocampal neurons. (a2–a5) Density of multiple types of spine in vehicle, 1 µM Q-VD-OPh and/or 1 µM oligomycin A treated hippocampal neurons (a2) Mushroom spine, (a3) Stubby spine, (a4) Filopodia, (a5) Thin spine. Two-way ANOVA followed by Bonferroni post hoc analysis; *P < 0.05, **P < 0.01 and ***P < 0.001. n = 10–15 dendritic segments. (a6) Representative images of dendritic protrusions (green). Scale bar 5 µm. (b1) Cleaved Caspase 3 expression levels in dendritic protrusions of vehicle, 1 µM Q-VD-OPh and/or 1 µM oligomycin A treated hippocampal neurons. Two-way ANOVA followed by Bonferroni post hoc analysis; *P < 0.05. n = 15–30 dendritic protrusions. (b2) Representative images of Cleaved Caspase 3 (red), dendritic protrusions (green) and MAP2 (blue). Scale bar 5 µm. (c) Mitochondrial membrane potential of vehicle, 1 µM Q-VD-OPh and/or 1 µM oligomycin A treated hippocampal neuron dendritic (c1) and somatic (c2) mitochondria in the indicated treated hippocampal neurons. Two-way ANOVA followed by Bonferroni post hoc analysis; *P < 0.05, NS not significant, n = 35–40 dendritic segments, respectively. (c3) Representative images of TMRM. Images were recorded at time 0, 5, 10, 15, 20, 25, 30 min. Scale bar 50 µm. (d) Hippocampal neuronal ATP production under vehicle, 1 µM Q-VD-OPh and/or 1 µM oligomycin A treated. Two-way ANOVA followed by Bonferroni post hoc analysis; NS, not significant, *P < 0.05. n = 6 samples. (e1) Hippocampal dendritic mitochondrial ROS levels of vehicle, 1 µM Q-VD-OPh and/or 1 µM oligomycin A treated neuron cultures. Two-way ANOVA followed by Bonferroni post hoc analysis; NS, not significant, ***P < 0.001, n = 20–30 dendritic segments. (e2) Representative images of Mitosox Red staining. Mitochondria are labeled with Mitotracker green. Hoechst was applied for nucleus staining. Scale bar 20 µm.

