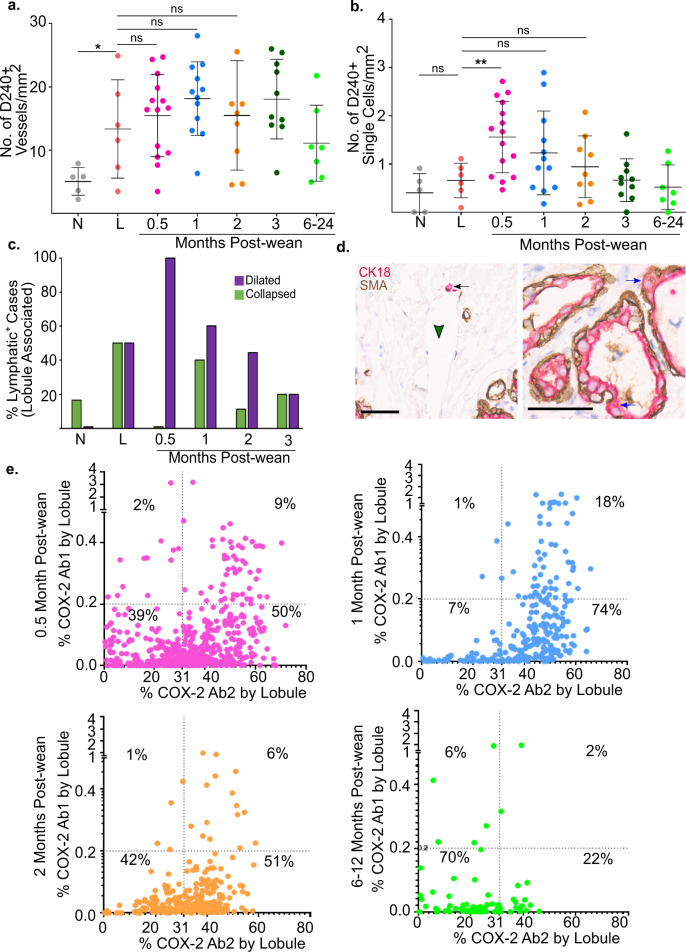
Fig. 4. Lymphatic density and function increase during early weeks of weaning-induced involution.
a Lymphatic density measured by D2–40+ vessels/mm2 for each group by case including nulliparous (N) n = 5, lactation (L) n = 6, and 0.5 (n = 14), 1 (n = 12), 2 (n = 9), 3 (n = 10), 6–24 months post-wean (n = 7). b Number of D2–40+ single cells/mm2 for nulliparous (N) n = 5, lactation (L) n = 6, and 0.5 (n = 15), 1 (n = 12), 2 (n = 9), 3 (n = 10), 6–24 months post-wean (n = 7) cases. c Percentage of cases with dilated (purple) and collapsed (green) lymphatics present within 100 um of lobules in nulliparous (N) n = 5, lactation (L) n = 6, and 0.5 (n = 6), 1 (n = 9), 2 (n = 9), 3 (n = 10), 12–24 (n = 6) months post-wean. d Breast biopsy at 0.5 months post-wean stained for CK18 (red), SMA (brown), and hematoxylin counterstain (blue) showing CK18+ signal within mammary lymphatics (left panel) and basally located mammary epithelial cells outside the confines of the SMA+ myoepithelial cell layer (right panel). e Dot plots of lobules with positive COX-2 expression using Ab1 and Ab2 for 0.5, 1, 2, and 6–12 months post-wean. The K-means high and low COX-2 cutoff value (Ab1 = 0.2%, Ab2 = 31%) are shown by the dotted line (***P ≤ 0.001, **P ≤ 0.01, *P ≤ 0.05, scale bar = 50 µm).

