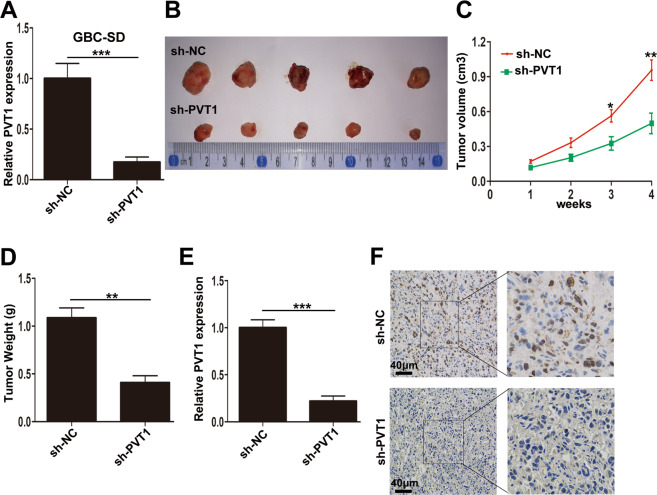
Fig. 3. The effect of PVT1 on GBC growth in vivo.
A The efficiency of sh-PVT1 in GBC-SD cells examined by qRT-PCR. B The tumor tissues from nude mice of GBC-SD/sh-NC and GBC-SD/sh-PVT1 groups. C The tumor volumes in two groups were evaluated every week until 4 weeks. D The tumor weight from two groups. E The relative expression of PVT1 in tumor tissues from two groups detected by qRT-PCR. F The Ki67 expression in tumors from two groups determined by immunohistochemical staining. *p < 0.05, **p < 0.01, ***p < 0.001.

