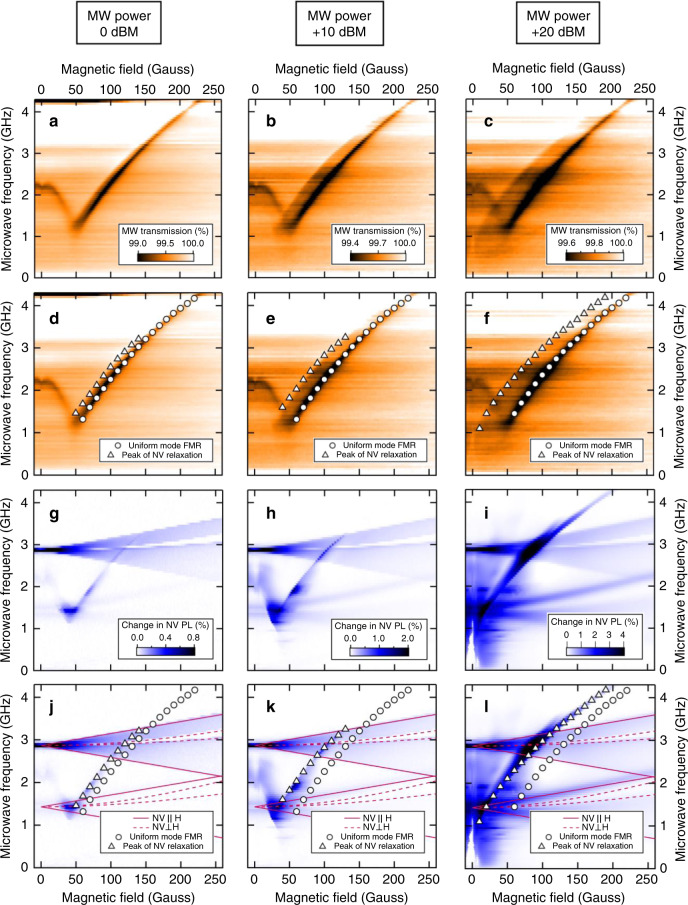
Fig. 5. Broadband microwave absorption and NV relaxation signals.
Field-swept broadband microwave absorption at 0 dBm (a, d), +10 dBm (b, e), and +20 dBm (c, f). Input microwave amplitude at each frequency tuned to maintain constant microwave transmission amplitude off resonance (see Supplementary Fig. 3). Instability shoulder visible on the low-field side of the uniform mode FMR in a–c. NV relaxation signal at 0 dBm (g, j), +10 dBm (h, k), and +20 dbm (i, l) recorded simultaneously to corresponding microwave absorption data. White circles in panels d–f, j–l correspond to the microwave absorption-detected uniform mode FMR, and white triangles in these panels correspond to the maximum of the NV relaxation signal, showing that the NV always responds most strongly to the instability. Red lines in panels j–l are the calculated NV frequencies for the ground and excited NV states as a function of magnetic field for magnetic field oriented parallel to the applied field (solid) and perpendicular (dashed). The low-field ferromagnetic resonance feature below 50 Gauss arises from the cubic anisotropy field and is not of importance for our main results.

