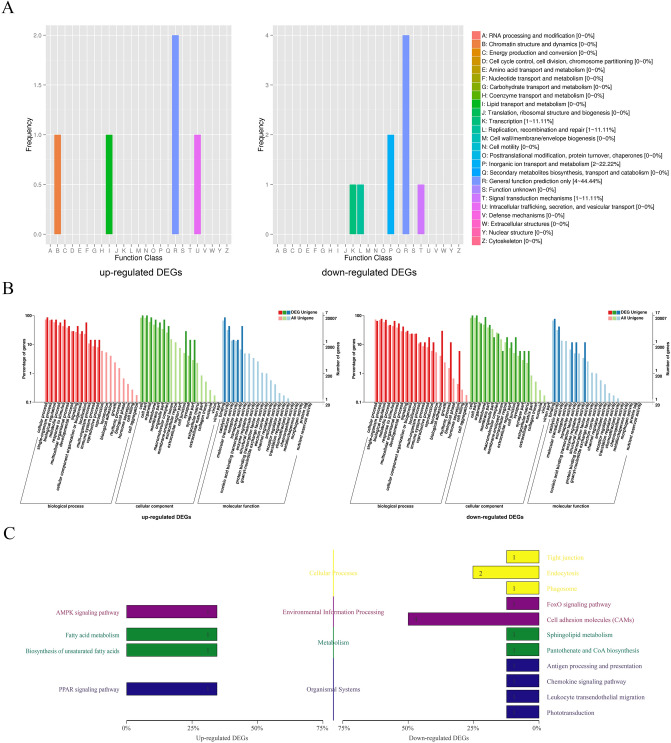
Figure 2.
Annotated statistical chart of DEGs. (A) Statistical map of COG annotation classification of DEGs showed the up-regulated DEGs were mainly distributed in chromatin structure and dynamics, lipid transport and metabolism, intracellular trafficking, secretion, and vesicular transport. And the down-regulated DEGs were mainly distributed in translation, replication, recombination and repair, signal transduction mechanisms, inorganic ion transport and metabolism. (B) Statistical map of GO annotation classification of DEGs showed that the up-regulated DEGs were mainly distributed in the reproductive process, localization and developmental process and signaling of the BP cluster, the membrane part, cell junction, and synapse part of the CC cluster, and the transporter activity, catalytic activity of the MF cluster. The down-regulated DEGs were distributed in the hormone secretion, rhythmic process and biological adhesion of the BP cluster, the extracellular matrix, synapse part and cell junction of the CC cluster, and the structural molecule activity, nucleic acid binding transcription factor activity and transporter activity of the MF cluster. C. KEGG classification map of DEGs showed the up-regulated DEGs were mainly concentrated in the AMPK signaling pathway (Environmental information processing), and PPAR signaling pathway (Organismal systems). The down-regulated DEGs were mainly concentrated in endocytosis (Cellular processes) and cell adhesion molecules (Environmental information processing).

