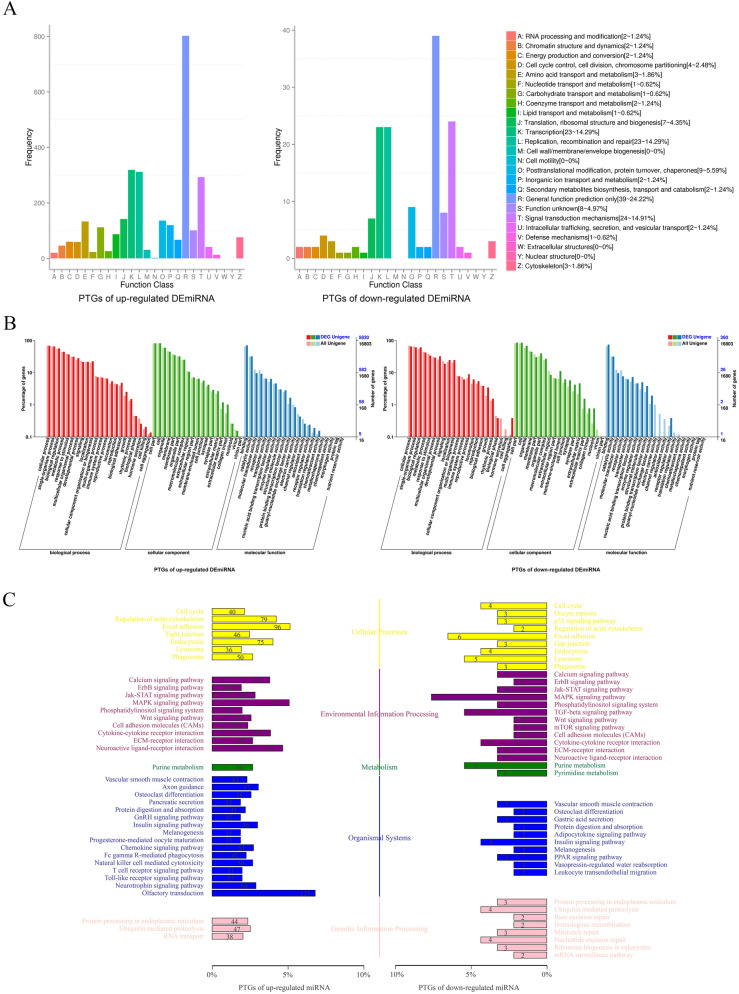
Figure 3.
Annotated statistical chart of PTGs. (A) Statistical map of COG annotation classification of PTGs showed that in addition to the general function prediction only of COG classification, no matter the up or down regulated DEmiRNAs, distribution of PTGs were mostly in transcription, replication, recombination and repair, signal transduction mechanisms. (B) Statistical map of GO annotation classification of PTGs showed that the main differences in the up-regulated DEmiRNAs PTGs were mainly distributed in the biological adhesion, growth and rhythmic process of the BP cluster, the synapse, extracellular matrix part and collagen trimer of the CC cluster, and the nucleic acid binding transcription factor activity, guanyl-nucleotide exchange factor activity, and the protein binding transcription factor activity of the MF cluster. The down-regulated DEmiRNAs PTGs were mainly distributed in the reproductive process, growth and cell aggregation of the BP cluster, the nucleoid, extracellular matrix part and synapse part of the CC cluster, and the receptor regulator activity, guanyl-nucleotide exchange factor activity, and structural molecule activity of the MF cluster. (C) KEGG Classification Map of PTGs showed the PTGs of the up-regulated DEGs were mainly concentrated in the focal adhesion (Cellular processes), MAPK signaling pathway (Environmental information processing), purine metabolism (Metabolism), axon guidance (Organismal systems) and ubiquitin mediated proteolysis (Genetic information processing). The PTGs of the down-regulated DEGs were mainly concentrated in focal adhesion (Cellular processes) and MAPK signaling pathway (Environmental information processing), purine metabolism (Metabolism), insulin signaling pathway (Organismal systems) and ubiquitin mediated proteolysis (Genetic information processing).

