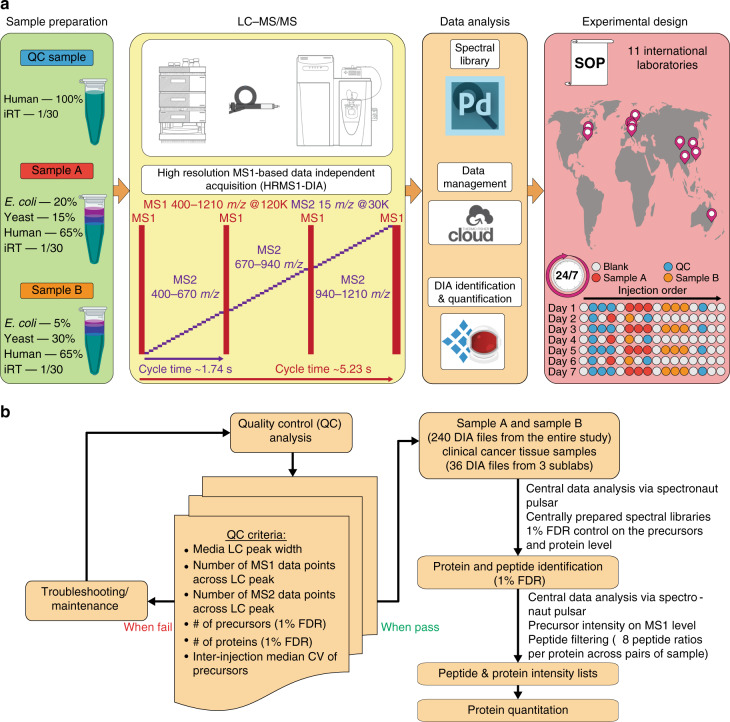
Fig. 1. Data acquisition and analysis using a streamlined HRMS1-DIA workflow.
a The quality control (QC) sample was a HeLa lysate digest. The controlled samples A and B were mixtures of HeLa, yeast, and E. coli lysates. The samples were analyzed by capillary LC-HRMS1-DIA on a Q Exactive HF system at eleven sites in a 24/7 mode for seven consecutive days. On days 1, 3, 5, and 7, all samples were run in three technical replicates; on days 2, 4, and 6, samples A and B were each run once, and the QC standard was run once before and after samples A and B. The rest of the time, the instruments were running blank injections. White circles are blank injections, blue circles are QC injections, red circles are Sample A injections, and orange circles are Sample B injections. b Quality control criteria were based on the evaluation of the performance of the capillary LC-HRMS1-DIA workflow before the 11 labs began the study (Supplementary Table 1). During the study, a QC standard was analyzed in three technical replicates on days 1, 3, 5, and 7. If the QC criteria were met, sample A and sample B data sets acquired on the same day were analyzed. If the QC standard analysis did not pass QC criteria, either instrument setup maintenance or troubleshooting were undertaken. In total, 240 DIA files from both sample A and sample B were centrally analyzed using Spectronaut (v11) with centrally generated spectral libraries. A criterion of 1% FDR was applied for identification at precursor and protein levels. The intensity of each identified peptide was exported to an.xls file, which was further processed via an R-script with the peptide-to-protein rollup pairwise ratio quantification strategy (see Methods section).

